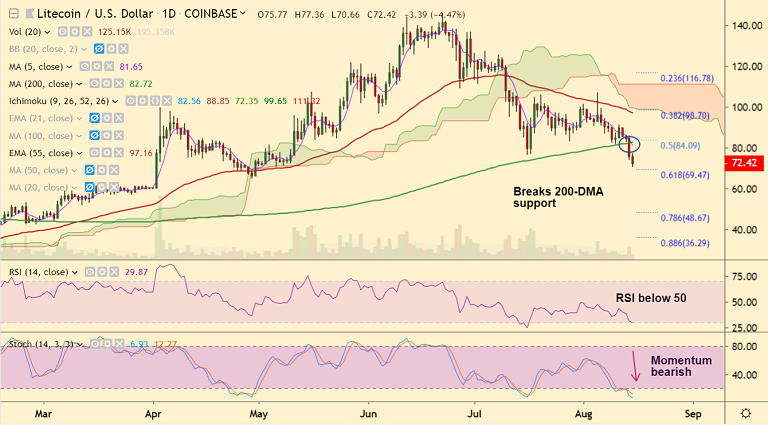
LTC/USD chart - Trading View
Exchange - Coinbase
Support: 69.47 (61.8% Fib); Resistance: 82.72 (200-DMA)
Technical Analysis: Bias Bearish
Litecoin has breached below 200-DMA support at 82.72 and is trading 4.7% lower on the day at 72.29 at 06:55 GMT.
LTC/USD is trading below 200-DMA for the 1st time since Feb 19th 2019, technical bias is bearish.
Volatility is expanding as indicated by widening Bollinger bands. MACD and ADX support downtrend.
GMMA indicators shows both major and minor trend are bearish. Parabolic SAR supports weakness.
The pair finds strong support at 110W EMA at 71.42. Decisive break below to see further downside.
Next immediate support lies at 61.8% Fib at 69.47 ahead of 64.86 (Apr 29 low). Retrace above 200-DMA negates near-term bearishness.