


 FxWirePro: GBP/USD hits one-month high, scope for further upside
  FxWirePro :USD/JPY bulls loosen their grip a bit, dips to be bought
  BTCUSD Bullish Breakout: Clears 800-EMA After Consolidation, Buy Dips Toward $74,900
  GBPUSD, AUDUSD & NZDUSD Turn Extremely Bullish: Strong Positive Momentum Drives Major Pair Action Bias
  FxWirePro: EUR/AUD outlook weaker on renewed downside pressure
  FxWirePro: GBP/NZD gains some upside momentum but still bearish
  AUDJPY Bullish Surge: Strong Australian Dollar Fuels Fresh Upside as Pair Holds Above 113.50 and All EMAs Align
  EUR/USD Holds Bullish Tone Despite Pullback from Yesterday’s High
  FxWirePro: USD/CAD falls after BoC rate hold and weak U.S. producer inflation


, break below opens up further downside - EconoTimes)


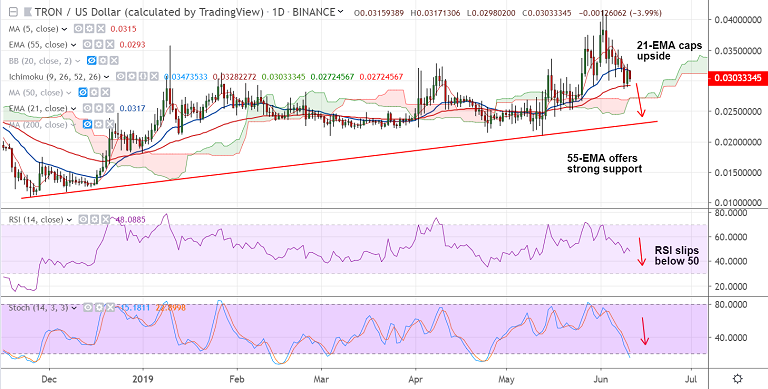
TRX/USD chart - Trading View
Exchange - Binance
Support: 0.0293 (55-EMA); Resistance: 0.0325 (20-DMA)
Technical Analysis: Bias Neutral
TRON is extending decline from 11-month highs at 0.04156 hit on Jun 2nd trade.
The pair has slipped below 21-EMA and is holding support at 55-EMA at 0.0293.
Technical indicators have turned slightly bearish. Scope for weakness.
Stochs and RSI are sharply lower and 5-DMA has turned. RSI has slipped below the 50 mark.
Furthermore, a 'Bearish Engulfing' candlestick pattern on the weekly charts aids downside bias.
Break below strong support at 55-EMA opens up further downside.
Next major support lies at daily cloud at 0.0272 ahead of 0.0227 (rising trendline).
For details on FxWirePro's Currency Strength Index, visit http://www.fxwirepro.com/currencyindex.


