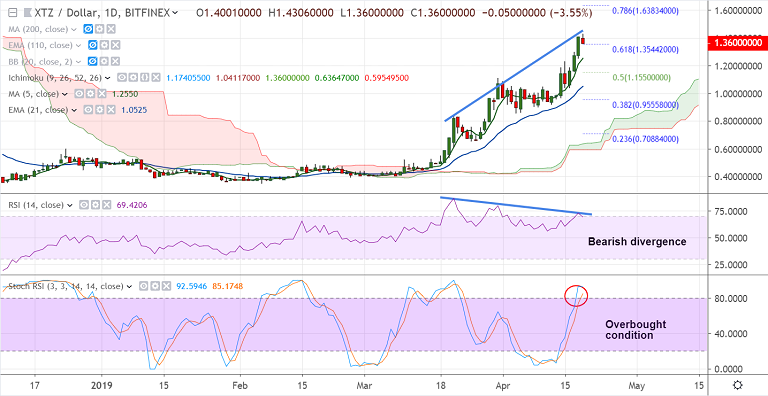
XTZ/USD chart - Trading View
Exchange - Bifinex
Support: 1.2550 (5-DMA); Resistance: 1.43 (Trendline)
Technical Analysis: Bias Bullish (signs of exhaustion)
- XTZ/USD has slipped lower from 6-month highs at 1.4306, signs of exhaustion seen at highs
- Pair has slipped below 1.40, Doji formation at highs raises scope for weakness
- Bearish divergence evidenced on daily charts, Stochs RSI has approached overbought conditions
- No major trend-reversal signs seen, possibility of pullback
- Immediate support seen at 5-DMA at 1.2607, break below will see drop till 21-EMA at 1.0551
- Bullish continuation finds next major resistance at 78.6% Fib at 1.6383
For details on FxWirePro's Currency Strength Index, visit http://www.fxwirepro.com/currencyindex.


FxWirePro- Major Pair levels and bias summary
Major Currency Pair Scores: USD/CHF Signals Strong Bullish Momentum as NZD/USD Turns Heavily Bearish
FxWirePro: USD/ZAR hits three-week high after hot U.S. PPI data
FxWirePro: EUR/NZD gaining momentum for a move towards 2.0100 level
EUR/USD Defies ECB Rate Hike to Reclaim 1.1600: Technical Setup Points to Buy-on-Dips Opportunity
FxWirePro- Major Pair levels and bias summary
FxWirePro: AUD/USD stays defensive ahead of key U.S. inflation data