


 FxWirePro: USD/JPY uptrend loses steam, remains on bullish path
  FxWirePro: GBP/USD hits one-month high, scope for further upside
  Major Pair Action Bias: Extremely Bullish Surge Powers GBPUSD & NZDUSD as Bullish Momentum Ignites
  AUDJPY Extremely Bullish Above 113: Strong AUD Fuels Fresh Rally – Buy Dips at 113 Targeting 115
  GBPJPY Bullish on Consolidation: Holds Above 216 After 218 Top – Buy Dips at 217 Targeting 220
  FxWirePro: NZD/USD steadies around 0.5830,retains bid tone
  GBPUSD, AUDUSD & NZDUSD Turn Extremely Bullish: Strong Positive Momentum Drives Major Pair Action Bias
  FxWirePro: GBP/USD advance after softer US inflation dims Fed rate hike bets
  BTCUSD Bullish Breakout: Clears 800-EMA After Consolidation, Buy Dips Toward $74,900
  FxWirePro: AUD/USD edges lower, but bullish outlook persists


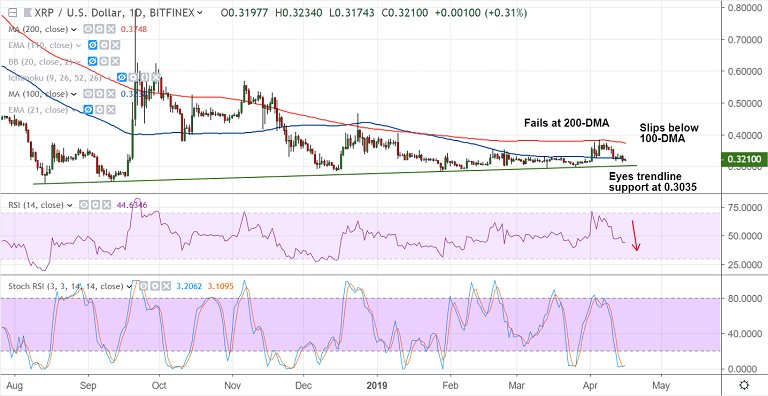
XRP/USD chart - Trading View
Exchange - Bifinex
Support: 0.3040 (trendline); Resistance: 0.3238 (100-DMA)
Technical Analysis: Bias Bearish
- XRP/USD fails at 200-DMA, slips below 100-DMA
- Price has fallen below major EMAs on the daily chart
- Stochs and RSI are sharply lower and RSI is below 50 mark
- Recovery lacks traction, upside capped at 100-DMA
- Scope for test of strong trendline support at 0.3035
For details on FxWirePro's Currency Strength Index, visit http://www.fxwirepro.com/currencyindex.

- News

- Economy

- Central Banks
- Investing
- Research
- Roundups
- Digital Currency
- Insights
- Technical Analysis
- Technology
- Business
- Law
- Health
- Nature
- Fintech
- Science
- Topic
- Opinions
- ©Econometrics LLC . All Rights Reserved.
Crypto Technicals: XRP/USD capped below 100-DMA, dip till 0.3040 likely
Tuesday, April 16, 2019 1:32 PM UTC
Editor's Picks


- Market Data
Most Popular


