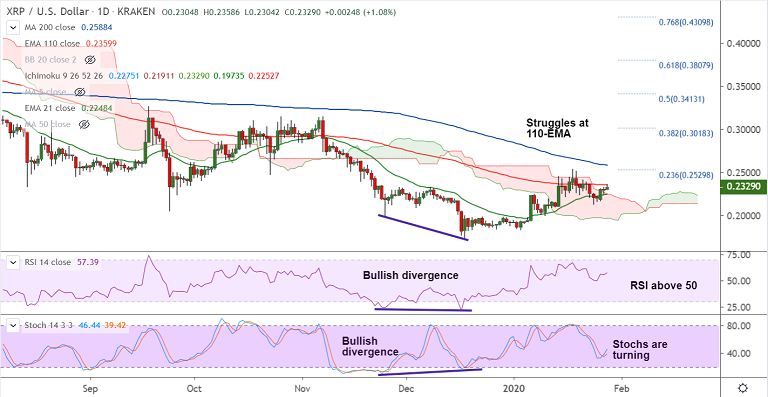
XRP/USD chart - Trading View
Exchange - Kraken
Technical Analysis: Bias Neutral
Support: 0.2268 (20-DMA); Resistance: 0.2359 (110-EMA)
XRP/USD has slipped lower from session highs at 0.2358 and was trading at 0.2324 at around 10:15 GMT.
The pair trades with a neutral bias and finds stiff resistance at 110-EMA at 0.2359.
Price action has edged above daily cloud and 'Golden Cross' (bullish 50-DMA crossover on 200-DMA) supports upside.
Technical indicators are slightly bullish. RSI holds above 50 mark and Stochs are turning.
Breakout at 110-EMA could buoy prices higher. Next bull target lies at 23.6% Fib at 0.2529 ahead of 200-DMA at 0.2588.
On the flipside, 5-DMA is immediate support at 0.2271. Break below 21-EMA will see further weakness.