ETH/EUR trades slightly below 10 level, decline till 7.53/6.52 likely
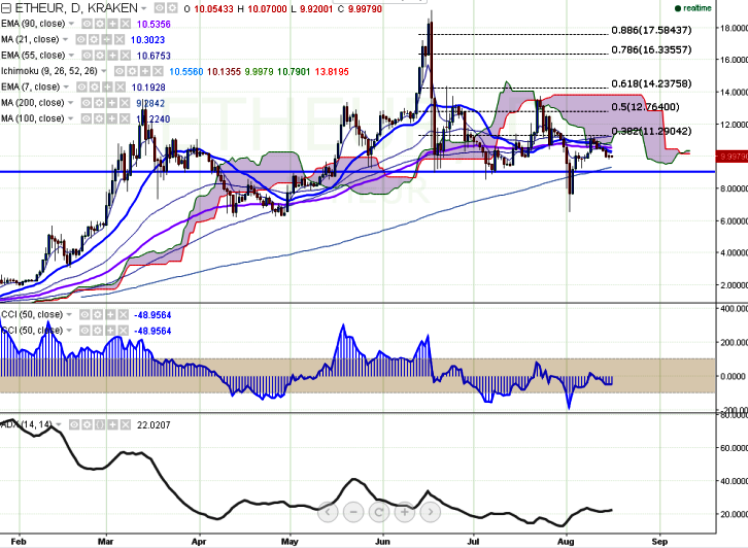
ETH/EUR is seen trading below in red on Tuesday. The pair has made a temporary top around 11.30 (Aug 9th, 2016 high) and declined from that level (KRAKEN). It is currently trading at 9.95 at the time of writing. Ichimoku…
By Sujha Sundararanjan
Updated 1 min read
Image from the original EconoTimes article
ETH/EUR is seen trading below in red on Tuesday. The pair has made a temporary top around 11.30 (Aug 9th, 2016 high) and declined from that level (KRAKEN). It is currently trading at 9.95 at the time of writing.
Ichimoku analysis of daily chart shows:
Tenkan-Sen level: 10.50
Kijun-Sen level: 10.13
Trend reversal level - (90 days EMA) – 10.55
Long-term trend remains to be bearish. In a daily chart, ETH/EUR breaks major support 10.33 (21 day MA) and declined till 9.81 yesterday. So a weakness till 9.24/6.55 is possible.
Major resistance can be noticed at 10.35 (21 day MA) and any break above that level will take the pair till 10.70 (55 days EMA)/11.30 (38.2% retracement of 13.75 and 6.52). Short term support is seen at 9.25 (200 day MA) and any violation below will drag the pair till 7.52 (78.6% retracement of 6.52 and 11.30)/6.52 (Aug 2nd low).