


 FxWirePro- Major Crypto levels and bias summary
  FxWirePro-24-Hour Crypto Category-Based Performance Dashboard
  FxWirePro- Major Crypto levels and bias summary


 Add as a preferred source on Google
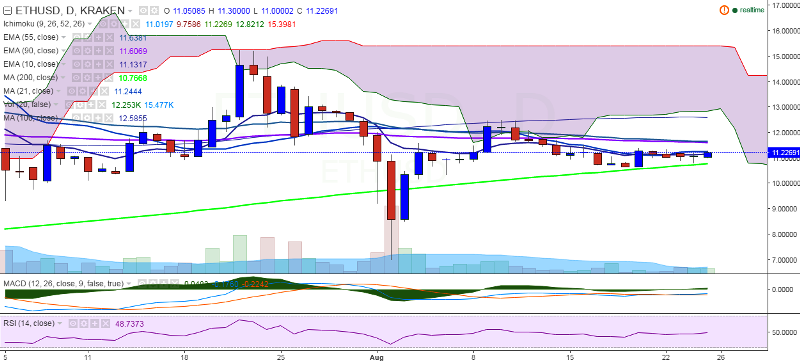
ETH/USD seems to have bounced back after finding support near 200-day MA. The pair is hovering around 21-day MA at 11.28 levels, at the time of writing (Kraken).
Ichimoku analysis of daily chart:
Tenkan Sen: 11.08
Kijun Sen: 9.90
Trend reversal: 11.61 (90 EMA)
The pair is struggling to close above 21-day MA, which would confirm minor bullishness. On the upside, major support is seen at 11.61 (90 EMA) and a break above will see the pair testing 12.59 levels (100-day MA)/ 13.63 (161.8% retracement of 12.49 and 10.67). On the downside, strong support is seen at 10.72 levels (200-day MA) and any violation will drag the pair to 9.10 (61.8% retracement of 7 and 12.49)/7.00 (August 2 low).

- News

- Economy

- Central Banks
- Investing
- Research
- Roundups
- Digital Currency
- Insights
- Technical Analysis
- Technology
- Business
- Law
- Health
- Nature
- Fintech
- Science
- Topic
- Opinions
- ©Econometrics LLC . All Rights Reserved.
ETH/USD rebounds from 200-day MA, bullishness only above 11.60
Thursday, August 25, 2016 11:40 AM UTC
Editor's Picks



- Market Data
Most Popular




