


 FxWirePro- Major Crypto levels and bias summary
  FxWirePro- Major Crypto levels and bias summary
  FxWirePro- Major Crypto levels and bias summary
  Ethereum Cracks Under $1,700: Sell the Rally Near $1,750 as Bears Eye $1,380–$1,200
  BTC’s Bear Bounce: Sell the Rally Near $66K as Bears Target $59K–$52K Breakdown


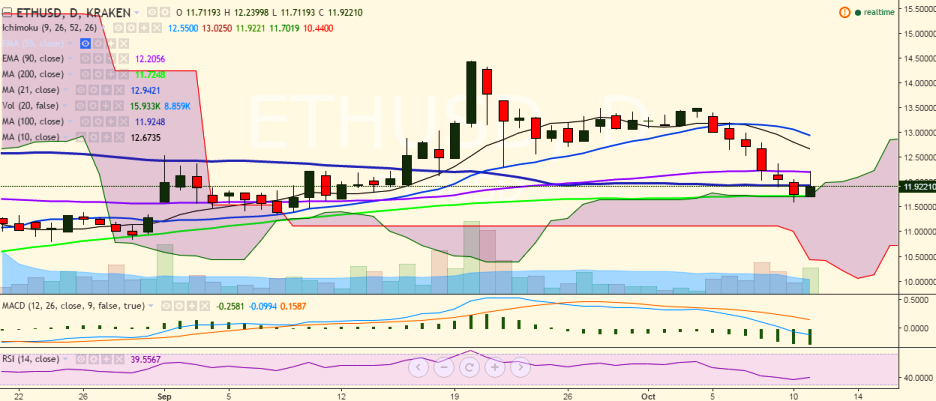
ETH/USD reversed its downtrend after hitting a low of 11.60 levels on Monday. The pair hit 12.23 levels so far in the day and is currently trading at 11.92 levels (Kraken).
Ichimoku analysis of daily chart:
Tenkan Sen: 12.55
Kijun Sen: 13.02
Trend reversal: 12.21 (90 EMA)
“The pair has taken support near 200-day MA and has retreated after facing resistance at 90-EMA. It must break above 12.21 levels for further upside”, FxWirePro said in a statement.
Major resistance is seen at 12.21 (90 EMA) and a break above would see the pair testing 12.80 (10-DMA)/ 13.06 (21-DMA)/13.50 (October 4 high).
The pair has taken support at 11.72 (200-DMA) and any violation would drag it to 11.60 (October 10 low)/11.00/10.65 (August 19 low).

- News

- Economy

- Central Banks
- Investing
- Research
- Roundups
- Digital Currency
- Insights
- Technical Analysis
- Technology
- Business
- Law
- Health
- Nature
- Fintech
- Science
- Topic
- Opinions
- ©Econometrics LLC . All Rights Reserved.
ETH/USD takes support at 200-DMA, must break above 12.21 for further upside
Tuesday, October 11, 2016 10:54 AM UTC
Editor's Picks


- Market Data
Most Popular


