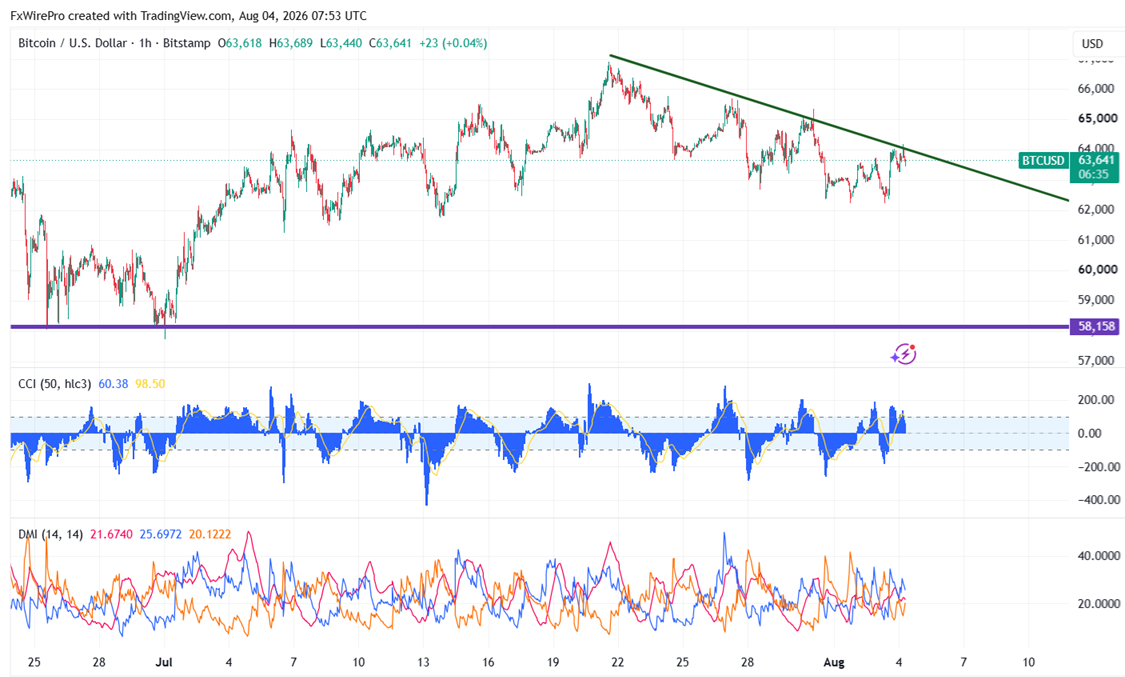
BTCUSD formed a double bottom near $61800-$62000 and showed a nice pullback on easing geopolitical tension. It hit an intraday high of $64176 and is currently trading around $63908. Any break or close above trend-line resistance and 800 H EMA ($64020) confirms further bullishness.
|
Technicals |
CMP -$63988 |
Trend |
|
|
4- Hour chart |
Value |
|
|
|
55 EMA |
$63327 |
CMP>55 EMA |
Bullish |
|
200- EMA |
$63654 |
CMP >200- EMA |
Bullish |
|
365- EMA |
$63857 |
CMP>365 EMA |
Bullish |
|
800-EMA |
$64020 |
CMP>Value |
Bearish |
Major support- $57700/$52796. The pair is facing strong around $64050 . Any break targets $67700/$70000/$72200/474950.
|
Momentum indicator (1-hour chart) |
Inference |
Value |
|
CCI(50) |
Bullish |
137.62 |
|
ADX |
Bullish |
Strength increased from 22.23 to 22.60 |
It is good to buy above $64050 with an SL around $63000 for a TP of $67700/$70000.