


 FxWirePro- Major Crypto levels and bias summary
  FxWirePro- Major Crypto levels and bias summary
  Ethereum Cracks Under $1,700: Sell the Rally Near $1,750 as Bears Eye $1,380–$1,200
  BTC’s Bear Bounce: Sell the Rally Near $66K as Bears Target $59K–$52K Breakdown


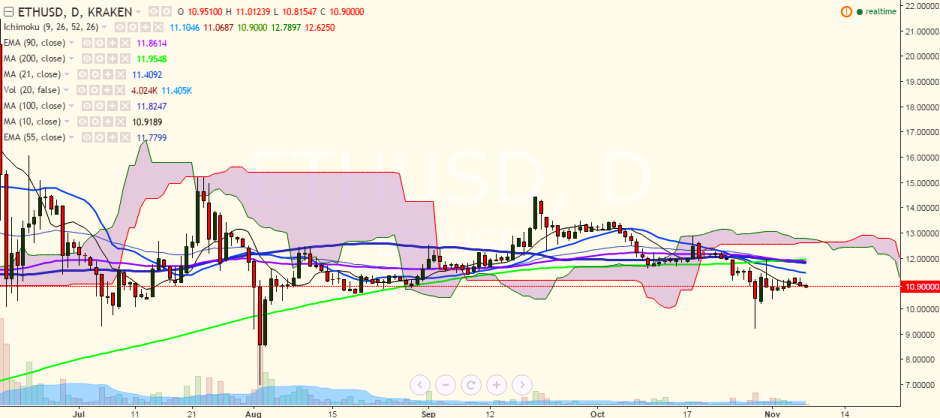
ETH/USD is continuing its downtrend after hitting 11.24 levels on November 05. It is currently trading at 10.90 levels (Kraken).
Long term trend: neutral
Ichimoku analysis (Daily chart):
Tenkan-Sen $10.61
Kijun-Sen $11.06
Trend reversal - $11.84 (100 day MA)
“The pair has taken support near 10-day MA and a close below would confirm further bearishness”, FxWirePro said in a statement.
Major resistance is seen at 11.23 (38.2% $14.45 and $9.23) and any break above targets 11.84 (100- day MA)/12 (31st Oct high).
On the other hand, support is seen at $10.61 (daily Tenkan-Sen) and break below targets 10.29 (61.8% retracement of 9.23 and 12)/9.23 (Oct 29 low).

- News

- Economy

- Central Banks
- Investing
- Research
- Roundups
- Digital Currency
- Insights
- Technical Analysis
- Technology
- Business
- Law
- Health
- Nature
- Fintech
- Science
- Topic
- Opinions
- ©Econometrics LLC . All Rights Reserved.
ETH/USD takes support near 10-DMA, close below confirms further weakness
Monday, November 7, 2016 12:01 PM UTC
Editor's Picks


- Market Data
Most Popular


