


 GBPUSD, AUDUSD & NZDUSD Turn Extremely Bullish: Strong Positive Momentum Drives Major Pair Action Bias
  FxWirePro- Major Crypto levels and bias summary
  FxWirePro- Major Pair levels and bias summary
  GBPJPY Stuck in Tight Range – Neutral Bias Persists Despite Bullish EMAs
  FxWirePro: NZD/USD advances as hawkish outlook by a top policy maker boosts kiwi dollar
  FxWirePro: GBP/AUD loses momentum but outlook is bullish


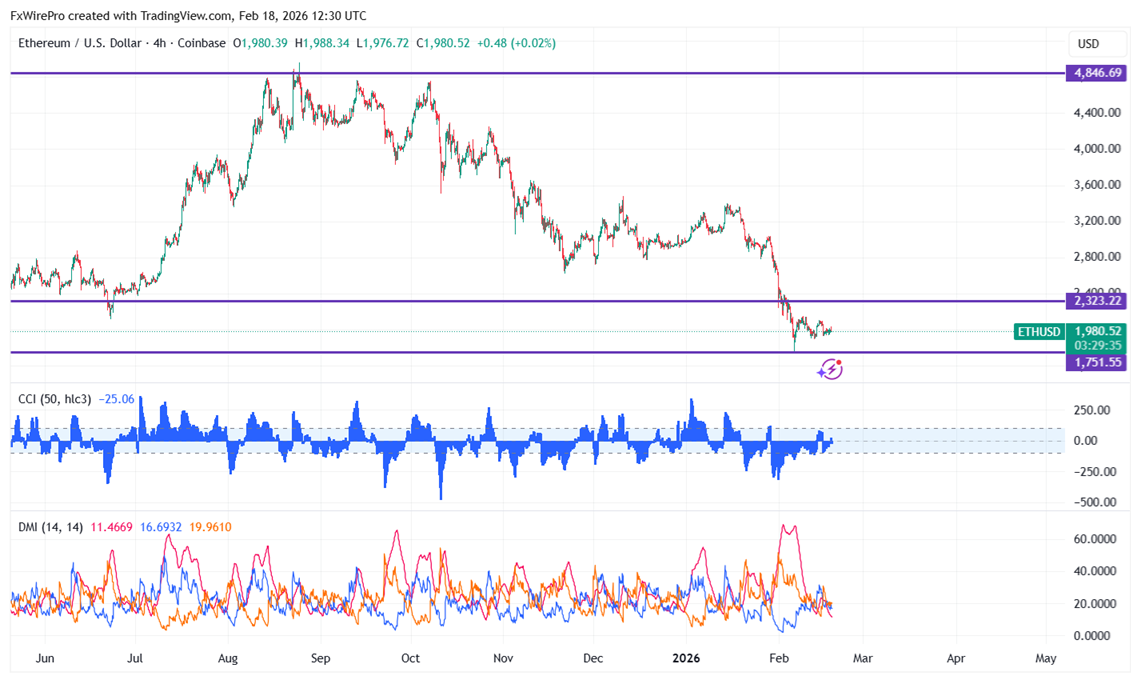
Following Bitcoin's trend, ETHUSD fell below $2000 again. Yesterday's high was $2038, and it is now trading near $1983.
|
Technicals |
CMP -$1983 |
Trend |
|
|
4- Hour chart |
Value |
|
|
|
55 EMA |
$2030 |
CMP < 55 EMA |
Bearish |
|
200- EMA |
$2383 |
CMP < 200- EMA |
Bearish |
|
365- EMA |
$2641 |
CMP < 365 EMA |
Bearish |
Major support- $1700/$1500. Minor bullishness only above $2200. Any violation above targets $2300/$2380.
|
Momentum indicator (1-hour chart) |
Inference |
Value |
|
CCI(50) |
Bearish |
-38.46 |
|
ADX |
Neutral |
Strength - 14.45. Declined from 17.39 |
It is good to sell on rallies around $2068-70 with SL around $2200 for a TP of $1750/$1500.


