


 FxWirePro: USD/ZAR downside pressure builds, key support level in focus
  ETHUSD Bullish Momentum: Follows BTC Above All EMAs, Buy Dips Near $1750 Targeting $2300
  FxWirePro: AUD/USD firms slightly, but downward resumption looks likely
  FxWirePro: NZD/USD advances as hawkish outlook by a top policy maker boosts kiwi dollar
  Crypto Major Pair Action Bias: ETHUSD Bullish as BTCUSD, SOLUSD & XRPUSD Stay Neutral
  NZDJPY Extremely Bullish Above 94: Broad NZD Buying Fuels Fresh Upside – Buy Dips at 93.70 Targeting 95
  BTCUSD Bullish Breakout: Clears 800-EMA After Consolidation, Buy Dips Toward $74,900
  FxWirePro: GBP/AUD loses momentum but outlook is bullish


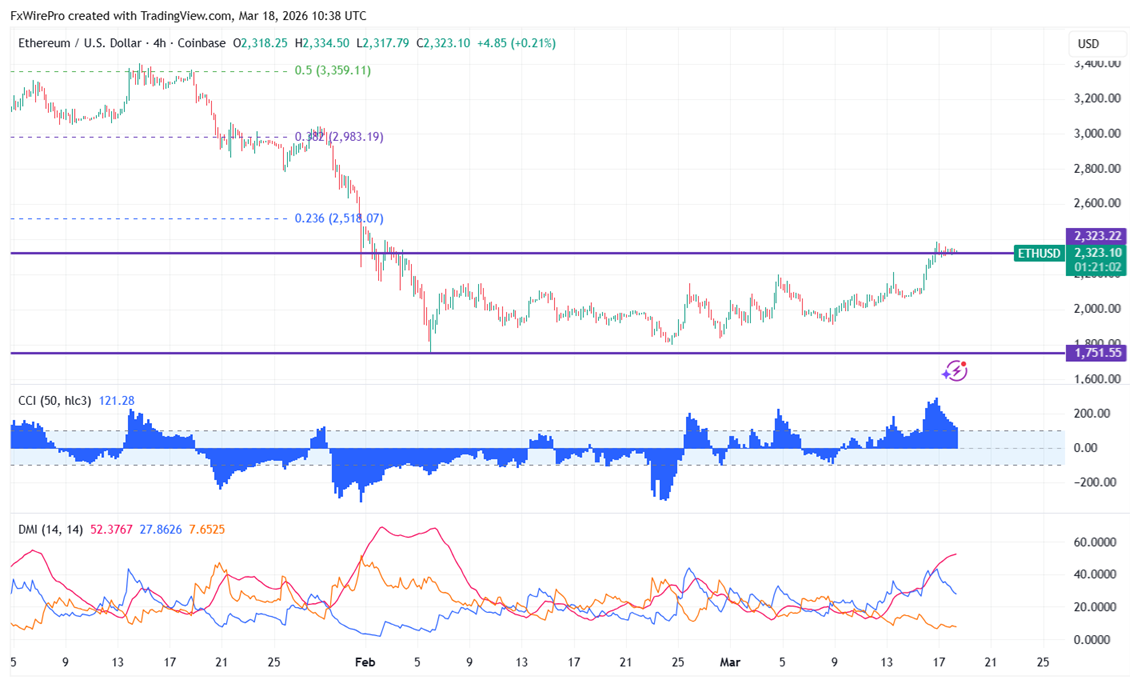
Ethereum trades in a narrow range after a jump of more than $500. After hitting a peak around $2386, it’s currently hovering near $2324.
|
Technicals |
CMP -$2324 |
Trend |
|
|
4- Hour chart |
Value |
|
|
|
55 EMA |
$2121 |
CMP > 55 EMA |
Bullish |
|
200- EMA |
$2127 |
CMP > 200- EMA |
Bullish |
|
365- EMA |
$2285 |
CMP >365 EMA |
Bullish |
Major support- $1700/$1500. Minor bullishness only above $2386. Any violation above targets $2500/$2700/$2880/$3000.
|
Momentum indicator (4-hour chart) |
Inference |
Value |
|
CCI(50) |
Bullish |
129.30 |
|
ADX |
Bullish |
Strength increased from 45 to 48 |
It is good to buy on dips around $2200, with a SL of $2000 and a TP of $2770.


