


 EUR/JPY Poised to Slide — Sell Rallies into 185.30 with Eye on 183"
  Crypto Major Pair Action Bias: ETHUSD Bullish as BTCUSD, SOLUSD & XRPUSD Stay Neutral
  FxWirePro- Major Crypto levels and bias summary
  AUDJPY Extremely Bullish Above 113: Strong AUD Fuels Fresh Rally – Buy Dips at 113 Targeting 115
  GBPJPY Stuck in Tight Range – Neutral Bias Persists Despite Bullish EMAs
  GBPUSD, AUDUSD & NZDUSD Turn Extremely Bullish: Strong Positive Momentum Drives Major Pair Action Bias
  FxWirePro: NZD/USD advances as hawkish outlook by a top policy maker boosts kiwi dollar
  FxWirePro: NZD/USD steadies around 0.5830,retains bid tone
  FxWirePro- Major Crypto levels and bias summary
  FxWirePro: GBP/NZD downtrend slows, but bearish sentiment remains


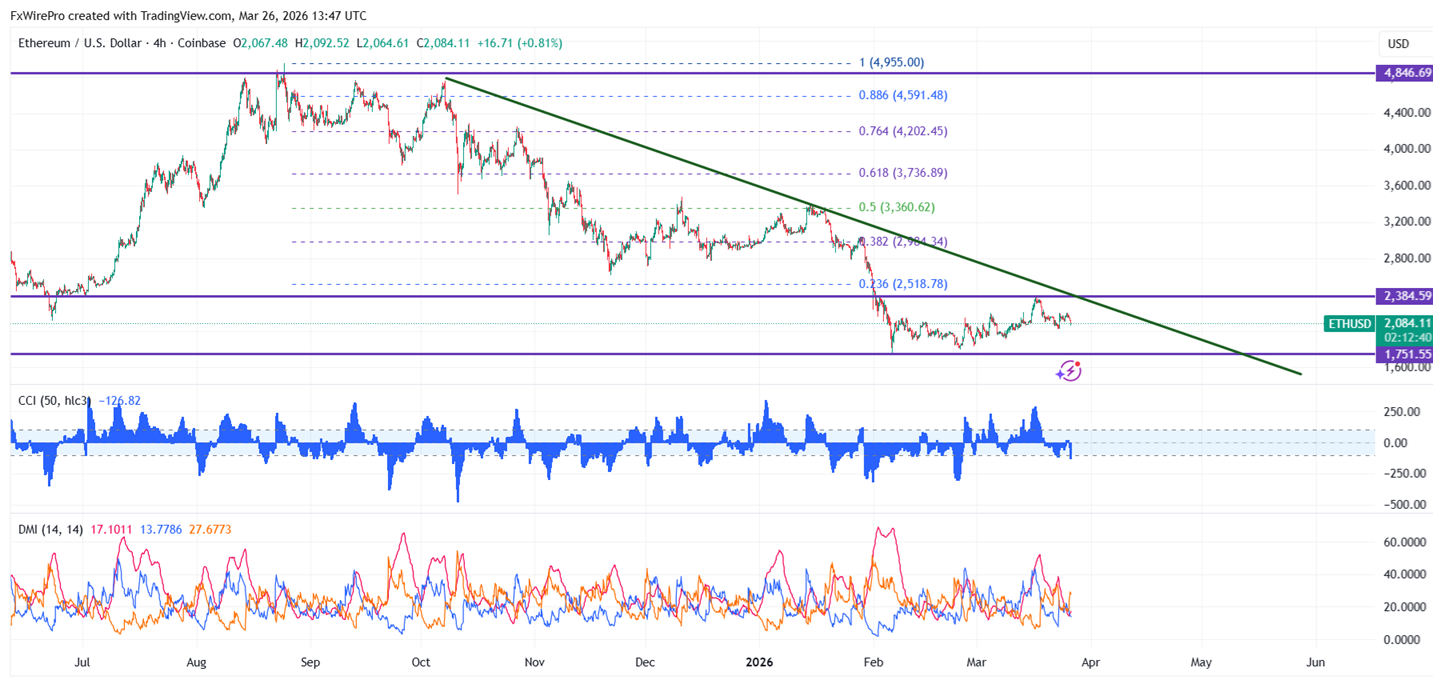
Ethereum pared some of its gains following the footsteps of ETH. After hitting a peak around $2199, it’s currently hovering near $2075.
|
Technicals |
CMP -$2075 |
Trend |
|
|
4- Hour chart |
Value |
|
|
|
55 EMA |
$2131 |
CMP < 55 EMA |
Bearish |
|
200- EMA |
$2132 |
CMP < 200- EMA |
Bearish |
|
365- EMA |
$2251 |
CMP < 365 EMA |
Bearish |
Major support- $1700/$1500. Minor bullishness only above $2200. Any violation above targets $2386/$2500/$2700/$2880/$3000.
|
Momentum indicator (4-hour chart) |
Inference |
Value |
|
CCI(50) |
Bearish |
-120.71 |
|
ADX |
Bearish |
Strength increased from 14.47 to 17.48 |
It is good to buy on dips around $2000 with SL around $1700 for a TP of $2770.


