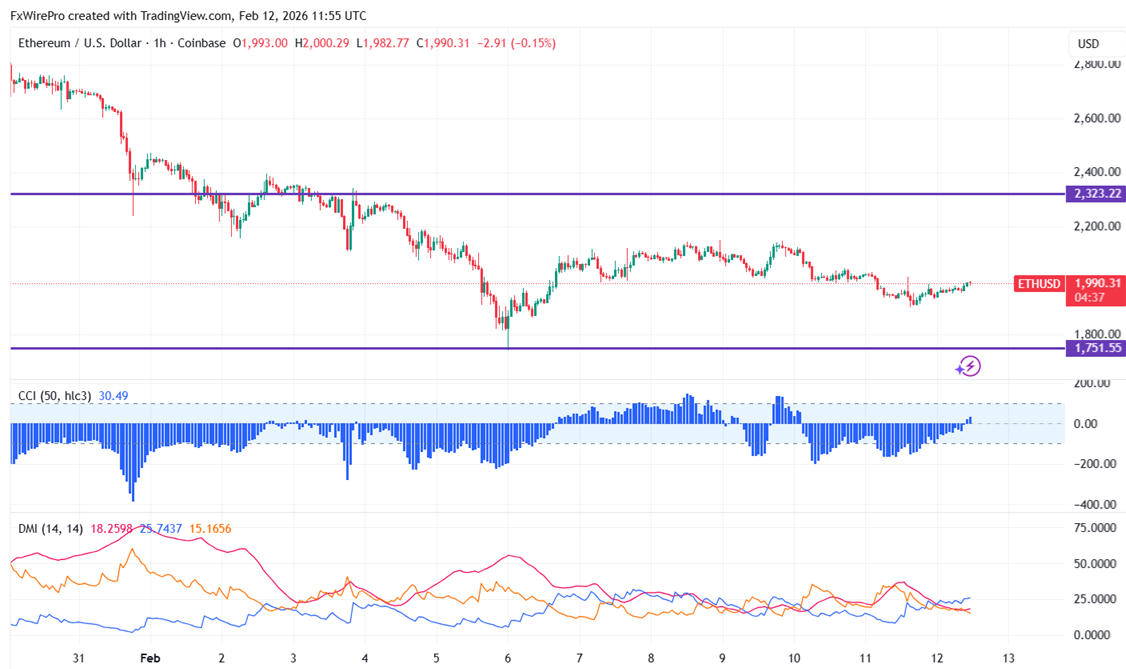
ETHUSD showed a minor pullback from temporary bottom $65720 made yesterday. It hits an intraday high of $68233 and is currently trading around $68019.
|
Technicals |
CMP -$1993 |
Trend |
|
|
1- Hour chart |
Value |
|
|
|
55 EMA |
$1986 |
CMP > 55 EMA |
Bullish |
|
200- EMA |
$2097 |
CMP is less than 200- EMA |
Bearish |
|
365- EMA |
$2263 |
CMP < Value |
Bearish |
In the 4- hour chart, the pair is trading well below short-term - $2118 (55-EMA) and long-term- $2784 (365- EMA) and $2554 (200-EMA).
Major support- $1900/$1700/$1470/$1380. Minor bullishness only above $2270.
|
Momentum indicator (1-hour chart) |
Inference |
Value |
|
CCI(50) |
Bullish |
21.51 |
|
ADX |
Bullish |
Strength - 17.67. It should cross above 20 level for bullish trend confirmation |
It is good to sell on rallies around $2048-50 with SL around $2270 for a TP of $1500.