


 Crypto Derivatives Dashboard: Bulls Retain Control Amid $488M Liquidation Flush
  U.S. Banks Report Strong Q4 Profits Amid Investment Banking Surge
  FxWirePro- Major Pair levels and bias summary
  NEAR Price Surges 11% as Trading Volume Doubles
  Polygon Labs Completes Coinme Acquisition, Expands U.S. Payments
  China’s Growth Faces Structural Challenges Amid Doubts Over Data
  2025 Market Outlook: Key January Events to Watch
  Bank of America Posts Strong Q4 2024 Results, Shares Rise
  Ripple Mints 19.6 Million RLUSD Amid Banking Expansion
  EURUSD Plummets Below 1.1150 Support as Hot U.S. CPI Sparks Bearish Momentum
  China's Refining Industry Faces Major Shakeup Amid Challenges
  Bank of America Fined $1.21B as CZ Questions AML Double Standard
  FxWirePro: GBP/NZD uptrend loses momentum but bullish setup remains
  S&P 500 Relies on Tech for Growth in Q4 2024, Says Barclays
  Most Americans Oppose Election Betting on Prediction Markets, Poll Finds
  Dogecoin Price Rebounds as DOGE Defends $0.08 Support


 Add as a preferred source on Google
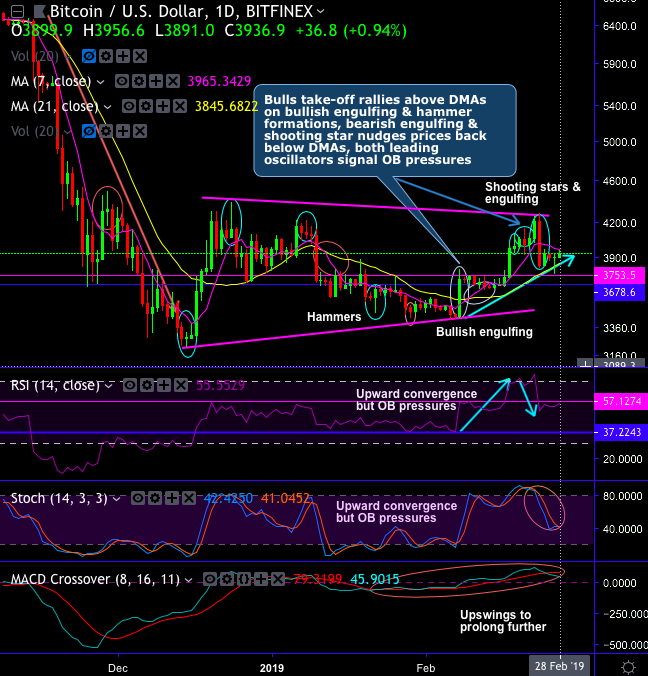
One can expect financial market bubbles in various kinds of asset classes, especially after the 2008 debt crisis, this terminology (bubble has been frequently utilized during bearish trend). However, one shouldn’t forget such a bubble also has to encompass the market life cycle. Well, we run you through what exactly do we mean to convey with a live instance of bitcoin price.
BTCUSD price has been oscillating between $4,384 and $3,215 levels, this price behavior has formed a wedge pattern.
It would be quite monotonous news if we keep analyzing any further that booms across the cryptocurrency gamut which is universally known. Yes, we meant constant steep slumps in the cryptocurrency prices in last one year or so. Nevertheless, one shouldn’t disregard the consolidation phase that has begun since mid-December.
Although Bitcoin and its peers had again resumed their bearish streaks beginning 2018, the price tumbles below $3,500 mark swiftly, as well as the yearly lows to generate new ones.
But in contrast, just quickly glance at the sharp rallies from the July 2013 lows of just $1 to the all-time highs of $19,891 levels (i.e. 19,89,000%) which was commendable in just 4-5 years. Such exponential returns can indeed be luring factor for the modern time investor class, isn’t it?
We’ve highlighted the booming cycles in the developing stage of the industry in the past as well.
It is explicitly illustrated about this perplexity referring to a concept called “booming cycle” of the price of BTCUSD back in our December 2017 post, please refer below weblink for further reading:
This is just a reiteration of the previous bearish swings may create yet another booming cycle, and the prevailing consolidation phase is such an evidence.
After referring to the above BTCUSD technical chart, we could foresee upside traction in the long run, even if some more dips are on the cards after retracing 78.6% Fibonacci levels in the short-run.
Although bearish sentiment could be owing to test the $3,200 mark, where the strong support has been observed. We wouldn’t be surprised even if the stronger selling pressure could take it down further to the levels of $2,500-2,750. Hence, the investor has to determine his risk appetite and decide whether this asset class is going to be in the dawn or the doomsday as the luring upside traction is also foreseen by investment veterans in the long-run. We have come across some crazy bullish targets upto $40k in the long-run.
Currency Strength Index: FxWirePro's hourly BTC spot index has shown -139 (which is bearish), while hourly USD spot index was at -4 (neutral), while articulating at 11:43 GMT.
For more details on the index, please refer below weblink: http://www.fxwirepro.com/currencyindex







