


 JPY Currency Meter Signals: NZDJPY Bullish (+25) vs CHFJPY (-100) – These Pairs Could Move Next
  FxWirePro: EUR/ AUD dips below 1.6400 level, focus on near term support
  US Magnificent 7 Stocks Trend Score: Amazon & Microsoft Hit Extreme Bullish (+100) as Meta Drops to -100 — Key Resistance & Support Watchlist
  FxWirePro- Major Crypto levels and bias summary
  FxWirePro: NZD/USD consolidates overnight gains, but loses momentum
  FxWirePro: GBP/NZD remains weak, eyes 38.2%fib support
  US Magnificent 7 Stocks Trend Score: Amazon & Microsoft Hit Extreme Bullish (+100) as Meta Drops to -100 — Key Resistance & Support Watchlist
  AUDJPY Volatile After Massive Sell-Off: Sell Rallies at 113, Targeting 110 as Bearish Momentum Surges
  FxWirePro- Major Crypto levels and bias summary
  Nikkei Surges Past 65,000 on Suspected Yen Weakness: Tech Giants Like Advantest and NEC Lead Explosive Gains
  FxWirePro: GBP/AUD bears maintain upper hand
  FxWirePro- Woodies pivot (Major)
  Major European Indices Score Extremely Bullish: DAX Eyes 26000, CAC Targets 8600, FTSE100 at 11000 – Key Levels to Watch
  FxWirePro: USD/CAD retreats after Canada posts stronger-than-expected GDP growth
  FxWirePro:USD/JPY climbs back above 160.00 after BOJ rate decision


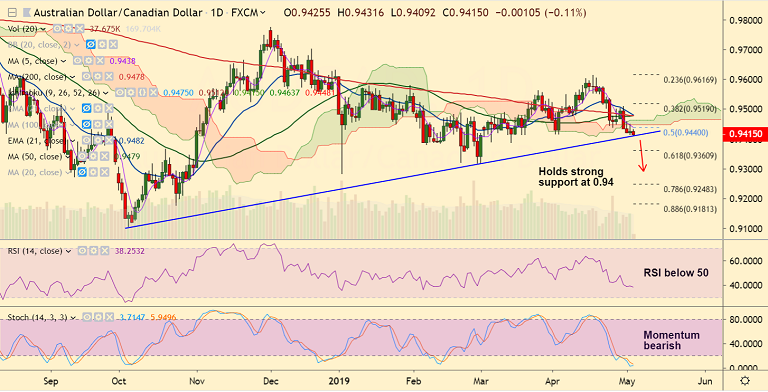
AUD/CAD chart - Trading View
Fundamental View:
- Aussie dampened following the release of the weak Australia building permits data.
- Australia Building Permits fell 15.5% in March, almost reversing the 19.1% rise seen in February. The markets were expecting a drop of 14%.
- Weaker-than-expected data will likely strengthen the dovish RBA expectations, raising probability of a rate cut on Tuesday
Technical Analysis:
- Price action has fallen below cloud and major moving averages
- Minor recovery attempts capped at 5-DMA and cloud base
- Volatility rising as evidenced by expanding Bollinger Bands on the daily charts
- RSI and MACD sharply lower, RSI below 50 showing strength of bearish momentum
- Strong support seen at trendline support at 0.94, break below eyes 61.8% Fib at 0.9360
- 5-DMA is immediate resistance at 0.9439, break above cloud negates bearish bias
Support levels - 0.94 (trendline), 0.9360 (61.8% Fib), 0.9316 (Mar 1 low)
Resistance levels - 0.9439 (5-DMA), 0.9478 (200-DMA), 0.95
Recommendation: Stay short on break below 0.94, SL: 0.9475, TP: 0.9360/ 0.9320
For details on FxWirePro's Currency Strength Index, visit http://www.fxwirepro.com/currencyindex.

- News

- Economy

- Central Banks
- Investing
- Research
- Roundups
- Digital Currency
- Insights
- Technical Analysis
- Technology
- Business
- Law
- Health
- Nature
- Fintech
- Science
- Topic
- Opinions
- ©Econometrics LLC . All Rights Reserved.
FxWirePro: AUD/CAD finds strong support at 0.94 handle, good to go short on break below
Friday, May 3, 2019 7:33 AM UTC
Editor's Picks


- Market Data
Most Popular


