


 JPY Action Bias: EURJPY and CADJPY Emerge as Extremely Bullish Pairs to Watch
  NZD/JPY Flatlines Near 94.60: Will Key Support Reignite the Uptrend?
  FxWirePro: GBP/NZD maintains bersish bias with focus on 2.2900 level
  FxWirePro: USD/ZAR firms ahead of Fed interest rate decision
  FxWirePro: NZD/USD neutral in the near-term, scope for downward resumption
  FxWirePro- Woodies pivot (Major)
  FxWirePro- Major Crypto levels and bias summary
  FxWirePro: NZD/USD firms as Kiwi gains on strong ANZ business outlook data
  Major Forex Pairs Action Bias: GBPUSD and AUDUSD Turn Extremely Bearish
  EURUSD Spikes to 1.14306 on Fed Pause as Traders Eye Sell-the-Rally Setup
  FxWirePro: AUD/USD dips below lower range, bearish bias increases
  AUD/JPY Slips Below 112 as BOJ Intervention Sparks Bearish Momentum: Sell the Rallies
  FxWirePro: USD/JPY edges higher as focus shifts to BOJ decision
  FxWirePro- Major Pair levels and bias summary
  FxWirePro: USD/JPY eases ahead of Fed decision , Intervention risks linger
  NZDJPY Bullish Rebound: Buy Dips as EMAs Align for 97 Target


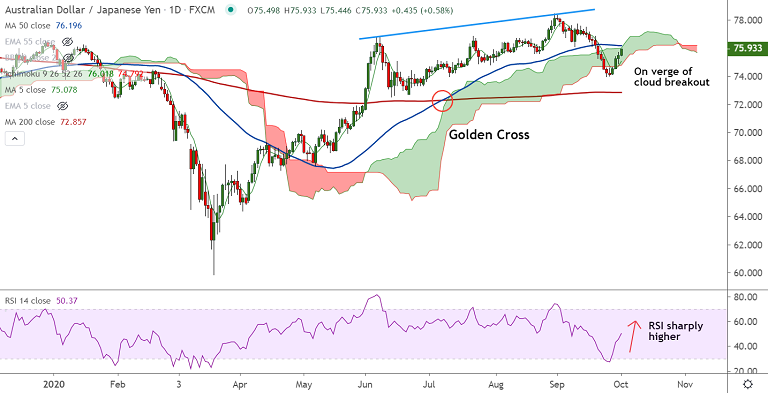
AUD/JPY chart - Trading View
Technical Analysis: Bias bullish
GMMA Indicator
- Major trend is neutral, while minor trend is bullish on the daily charts
- On the weekly charts, major and minor trend are neutral
Ichimoku Analysis
- Price action is on verge of breakout above daily cloud
- Chikou span is biased higher suggesting continuation of uptrend
Oscillators
- Stochs and RSI are biased higher and MACD is on verge of bullish crossover on signal line
Bollinger Bands
- Bollinger bands are wide on the daily and weekly charts
- Rising volatility could drive prices higher
Major Support Levels: 75.07 (5-DMA), 74.70 (110-EMA), 73.89 (Lower BB)
Major Resistance Levels: 76.05 (20-DMA), 76.19 (50-DMA), 78.67 (61.8% Fib)
Summary: AUD/JPY is extending gains for the 4th straight session and bullish momentum is likely to drive prices higher. Watch for breakout above daily cloud for further gains. Scope for test of 61.8% Fib at 78.67.


