


Refer AUD/JPY chart on Trading View
- AUD/JPY is extending retrace from multi-month lows at 79.70 hit on Wednesday's trade.
- Price action has bounced off strong trendline support at 80 and has broken above 5-DMA.
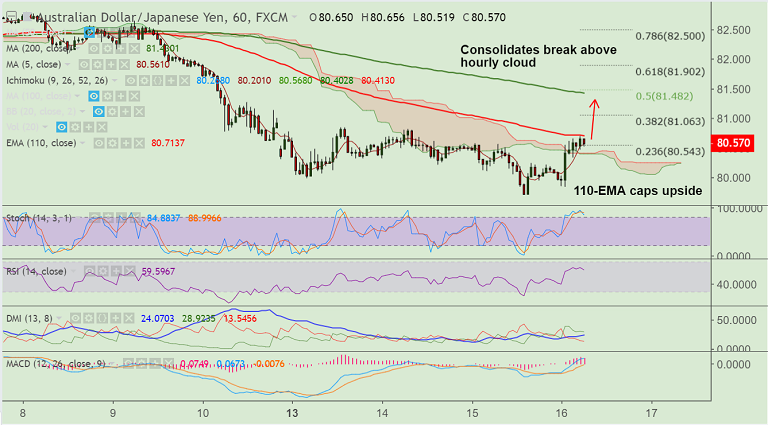
- Technical indicators on intraday charts are turning bullish, price is consolidating break above hourly cloud.
- 1H 110-EMA caps upside, break above to see further upside.
- Next strong resistance above 1H 110-EMA is seen at 38.2% Fib at 81.06. Break above could see test of 21-EMA. Further upside only on break above.
- On the flipside, close below strong trendline support at 80 mark could see further weakness.
Support levels - 80.40 (hourly cloud), 80, 79.70 (Aug 15 low)
Resistance levels - 80.71 (1H 110-EMA), 81.06 (38.2% Fib), 81.43 (1H 200 SMA)
Recommendation: Good to go long on break above 1H 110-EMA, SL: 80.40, TP: 81/ 81.40/ 81.70
FxWirePro Currency Strength Index: FxWirePro's Hourly AUD Spot Index was at 104.404 (Bullish), while Hourly JPY Spot Index was at -120.876 (Bearish) at 0615 GMT. For more details on FxWirePro's Currency Strength Index, visit http://www.fxwirepro.com/currencyindex.


