


 FxWirePro: USD/JPY edges higher as focus shifts to BOJ decision
  FxWirePro: USD/CAD runs out of steam but maintains bullish outlook
  NZD/JPY Flatlines Near 94.60: Will Key Support Reignite the Uptrend?
  FxWirePro: GBP/NZD maintains bersish bias with focus on 2.2900 level
  FxWirePro: USD/JPY eases ahead of Fed decision , Intervention risks linger
  FxWirePro: USD/ZAR firms ahead of Fed interest rate decision
  Major Forex Pairs Action Bias: GBPUSD and AUDUSD Turn Extremely Bearish
  FxWirePro: NZD/USD firms as Kiwi gains on strong ANZ business outlook data
  FxWirePro- Woodies pivot (Major)
  FxWirePro: AUD/USD falls after softer-than-expected Australian Q2 CPI
  FxWirePro: NZD/USD neutral in the near-term, scope for downward resumption
  FxWirePro: GBP/AUD gains above 1.9200 level , upside pressure builds
  FxWirePro:EUR/NZD gains some upside momentum but still bearish
  FxWirePro: AUD/USD dips below lower range, bearish bias increases
  FxWirePro: EUR/AUD regains upwards momentum but unable to hold above 50%fib level
  FxWirePro: USD/ CNY remains soft ahead of Fed decision
  FxWirePro: USD/ CNY hits one-month low,scope for futher downside


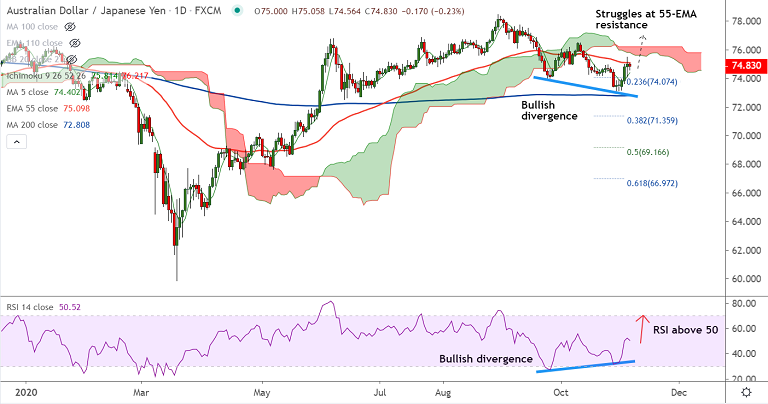
AUD/JPY chart - Trading View
AUD/JPY was trading 0.20% lower on the day at 74.85 at around 06:25 GMT, outlook remains bullish.
The pair has paused 5 straight sessions of gains, finds stiff resistance at 55-EMA. Decisive break above required for upside continuation.
Poor Australia’s September month Trade Balance data dents the AUD. Data released earlier today showed Australia’s Trade surplus shrank more than expected.
Australia’s September month Trade Balance eased to 5.63bn (3.7bn expected) as the big -5.9% drop in Imports supersede +3.9% rise in Exports.
Price action is above 200H MA and intraday technicals are bullishly aligned. MACD is showing a bullish crossover on signal line and 'Bullish RSI Divergence' adds to upside bias.
Support levels - 74.65 (21-EMA), 74.40 (5-DMA)
Resistance levels - 75.09 (55-EMA), 75.61 (110W EMA)
Summary: Risk sentiment to influence price action in the pair. Technical indicators have a bullish bias. breakout at 55-EMA resistance will buoy prices. Scope for test of 76.52 (Oct highs).


