
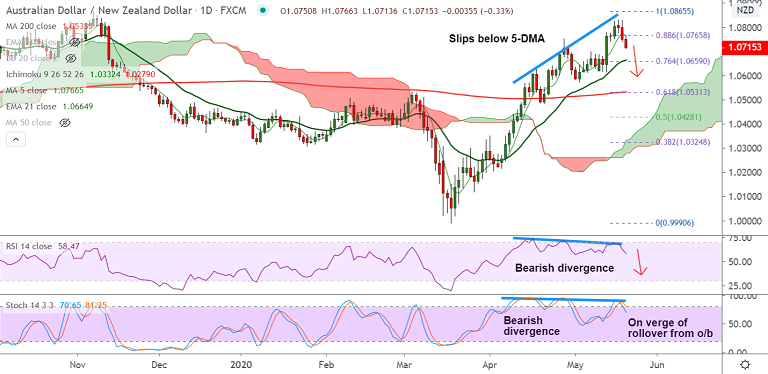
AUD/NZD chart - Trading View
AUD/NZD was trading 0.19% lower on the day at 1.0731 at around 10:50 GMT, after closing 0.46% lower in the previous session.
The pair is extending declines from 2020 highs at 1.0830 and more weakness seen on the charts.
Price action has slipped below 5-DMA and is grinding along 200H SMA support. 'Bearish divergence' on Stochs and RSI weighs on the upside.
Stochs and RSI are on verge of rollover from overbought levels and 5-DMA has turned South.
Price action has retraced below 88.6% Fib and we see a dip till 21-EMA (currently at 1.0666).
Major trend as evidenced by the GMMA indicator is bullish. Price action has broken above 200W MA.
21-EMA is likely to offer strong support. Further weakness only on break below. Retrace and close above 5-DMA negates bearish bias.
Support levels - 1.0681 (20-DMA), 1.0664 (21-EMA), 1.0533 (200-DMA)
Resistance levels - 1.0767 (5-DMA), 1.0830 (May 18 high), 1.0865 (Nov 2019 high)


