


 FxWirePro: EUR/AUD outlook weaker on renewed downside pressure
  FxWirePro- Major Pair levels and bias summary
  FxWirePro: GBP/USD edges higher as traders await BoE guidance and UK fiscal clarity
  FxWirePro: USD/ZAR uptrend loses steam, remains on bullish path
  FxWirePro: NZD/USD neutral in the near-term, scope for downward resumption
  FxWirePro: USD/JPY eases ahead of Fed decision , Intervention risks linger
  JPY Action Bias: USDJPY Emerges as the Clear Bullish Pair to Watch Amid Mixed Crosses
  Major Pairs Action Bias: USDCAD and USDCHF Stand Out as Extremely Bullish While GBPUSD and NZDUSD Turn Extremely Bearish
  FxWirePro: GBP/NZD gains some ground but bias is still bearish
  EUR/USD Bounces from Monthly Low, But Bearish Pressure Remains
  EUR/JPY Holds Bullish Bias as Euro Extends Recovery
  FxWirePro: GBP/AUD gains some upside momentum but still bearish
  FxWirePro: USD/CAD runs out of steam but maintains bullish outlook
  FxWirePro: GBP/NZD maintains bersish bias with focus on 2.2900 level
  Crypto Action Bias: ETHUSD Stands Out as the Bullish Pair to Watch
  FxWirePro- Woodies pivot (Major)


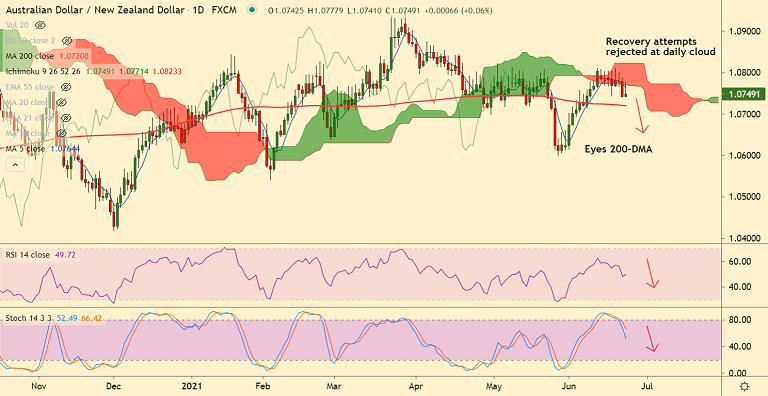
AUD/NZD chart - Trading View
Technical Bias: Bearish
- AUD/NZD was trading 0.08% higher on the day at 1.0750 at around 11:30 GMT
- Recovery attempts were capped at daily cloud, upside lacks traction
- 5-DMA has turned, price action has slipped below 200H MA
- Stochs confirm a bearish rollover from overbought levels, RSI is below 50
- Volatility is high as evidenced by wide Bollinger bands
Support levels - 1.0732 (20-DMA), 1.0720 (200-DMA), 1.0682 (50% Fib)
Resistance levels - 1.0764 (5-DMA), 1.08, 1.0823 (Cloud top)
Summary: AUD/NZD recovery attempts capped at daily cloud. The pair is currently on track to test of 200-DMA at 1.0720. Breach below 200-DMA will open further downside.


