


 JPY Action Bias: EURJPY and CADJPY Emerge as Extremely Bullish Pairs to Watch
  FxWirePro: USD/CAD slips after Fed holds rates steady
  JPY Pairs Action Bias: EURJPY Leads as Bullish Standout Amid Mixed Momentum
  FxWirePro: EUR/ AUD gains some ground , but remains on bearish path
  FxWirePro: EUR/AUD regains upwards momentum but unable to hold above 50%fib level
  NZD/JPY Flatlines Near 94.60: Will Key Support Reignite the Uptrend?
  Major Forex Pairs Action Bias: GBPUSD and AUDUSD Turn Extremely Bearish
  FxWirePro: NZD/USD neutral in the near-term, scope for downward resumption
  FxWirePro- Major Crypto levels and bias summary
  FxWirePro : GBP/NZD strongly bearish despite upside attempts
  FxWirePro: GBP/AUD gains some upside momentum but still bearish
  FxWirePro- Woodies pivot (Major)
  FxWirePro: NZD/USD firms as Kiwi gains on strong ANZ business outlook data
  FxWirePro: USD/JPY edges higher as focus shifts to BOJ decision
  FxWirePro: USD/ CNY remains soft ahead of Fed decision
  FxWirePro: GBP/USD edges lower ahead of Fed policy verdict


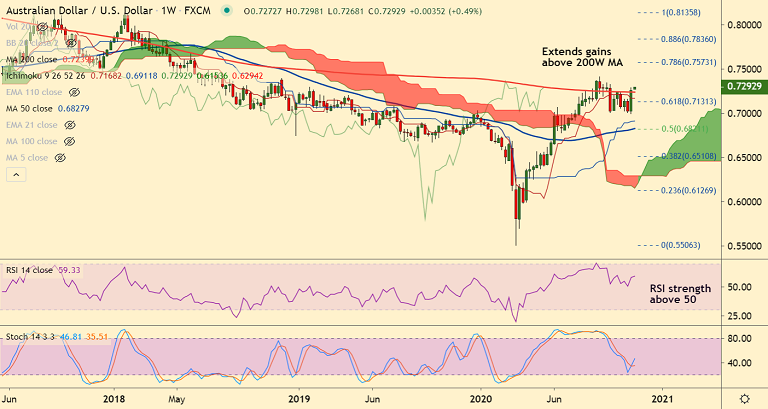
AUD/USD chart - Trading View
Technical Analysis: Bias Bearish
- AUD/USD opens the week on a positive note, makes a bullish gap open
- Price action is extending break above 200W MA and daily cloud
- Chikou span is biased higher on the daily and weekly charts suggesting further upside
- Oscillators are turning bullish on the daily charts and support strong upside on the weekly charts
- Bullish RSI divergence on the daily charts supports gains, rising volatility to drive prices higher
Support levels - 0.7239 (200W MA), 0.7233 (5-DMA), 0.7142 (55-EMA)
Resistance levels - 0.73 (Psychological level), 0.7413 (2020 high), 0.7575 (78.6% Fib)
Summary: AUD/USD is poised for upside in the near-term. Scope for test of 0.74 levels. Retrace below 200W MA to negate bullish bias.


