Technicals / Digital Currency

Add as a preferred source on Google

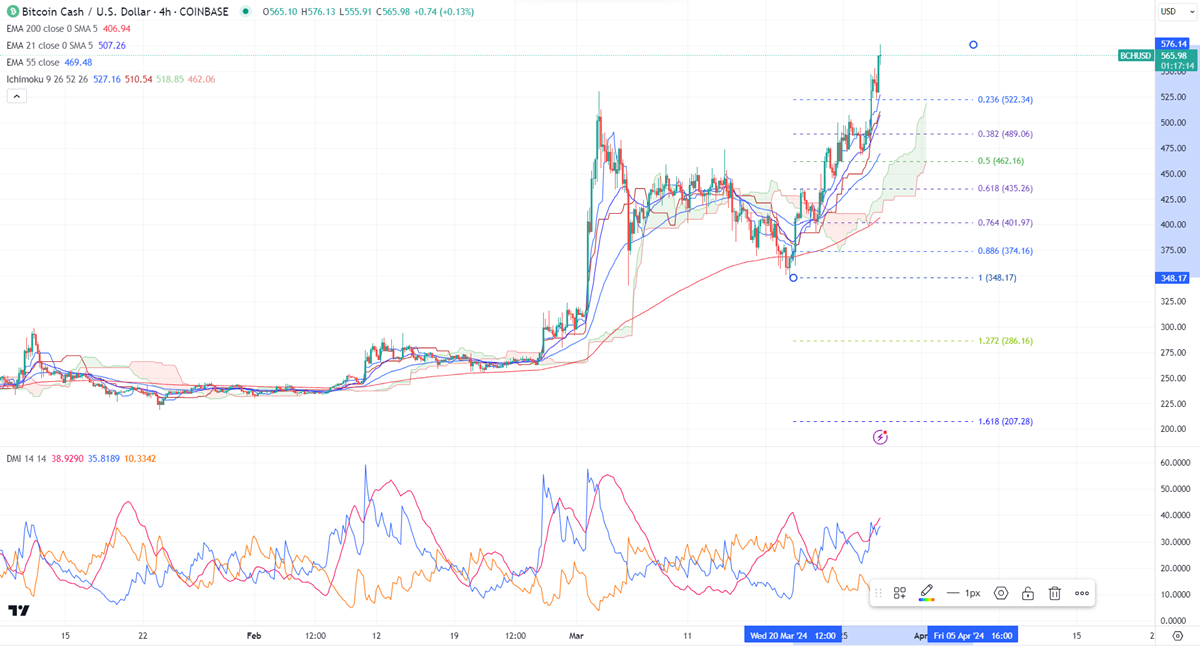
FxWirePro- BCHUSD (Chart of the day)

Ichimoku analysis (4- hour chart) Tenken-Sen- $518.50 Kijun-Sen- $505.15 BCHUSD has performed well after a long consolidation. Any daily close above $580 confirms further bullishness. BCHUSD prices have surged more than …

1 min read
FxWirePro- BCHUSD (Chart of the day)
Image from the original EconoTimes article

Read the original article

Ichimoku analysis (4- hour chart)


Tenken-Sen- $518.50


Kijun-Sen- $505.15


BCHUSD has performed well after a long consolidation.


Any daily close above $580 confirms further bullishness.


BCHUSD prices have surged more than 65% in the past one week.  It hit a high of $576.18 and is currently trading around $566. The pair is holding above the short-term (21 and 55-day EMA) and above the long-term moving average (200-day EMA).


The near-term resistance is around $580, any indicative breach above will take the pair to $600/$642. On the lower side, immediate support is $505, and any violation below targets $485/$435.


Indicators ( 4- hour chart)


Directional movement index - Bullish


It is good to buy on dips around $525 with SL around $485 for TP of $640.



Related articles

View all
Technicals

Major Pair Currency Score: AUDUSD Bearish

EURUSD - Levels to watch - 1.100 GBPUSD Levels to watch - 1.3180 USDCHF Levels to watch - 0.8400 USDCAD - Levels to watch - 1.4300 AUDUSD - Levels to watch - 0.7000 NZDUSD - Levels to watch - 0.5560

