Key Level to Monitor: $640
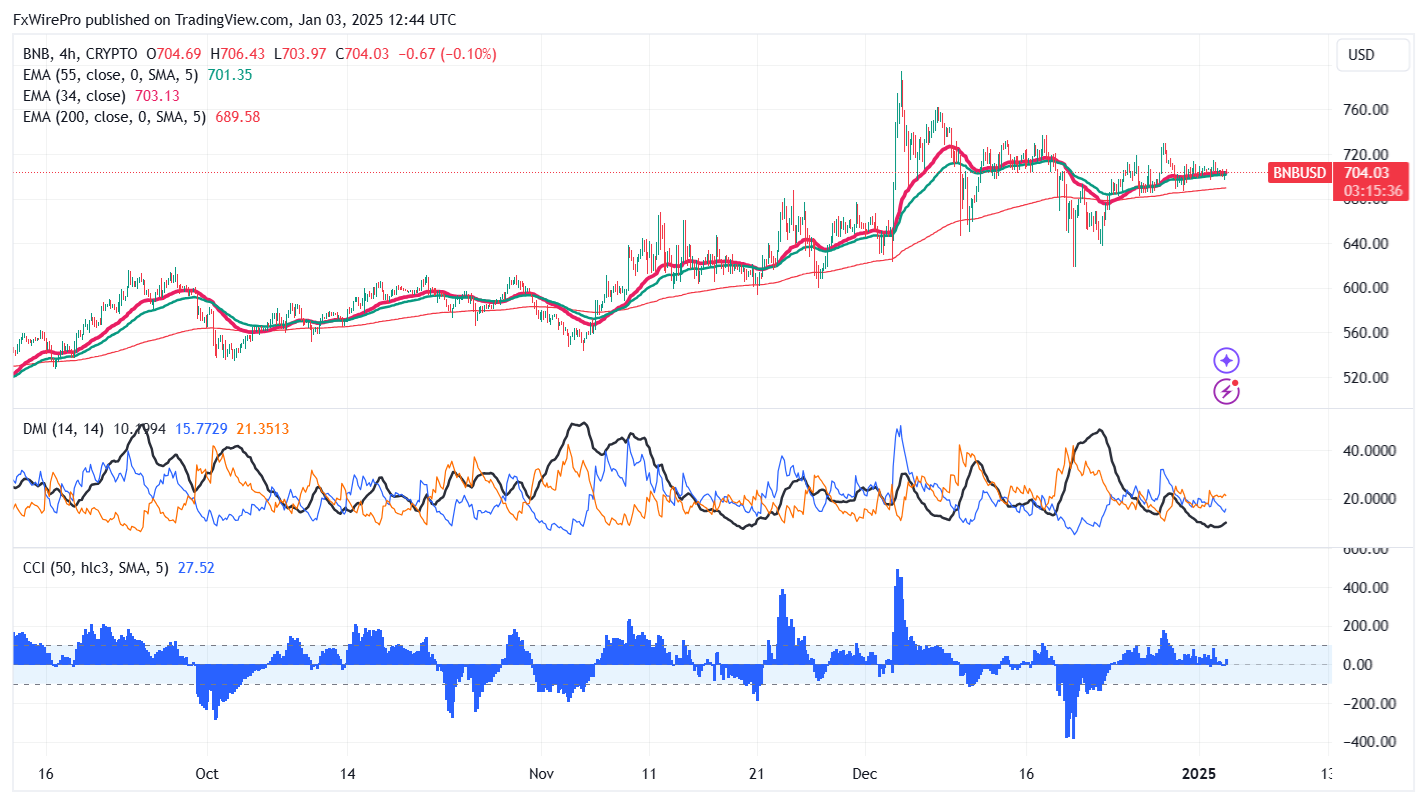
BNB/USD pair trading in a narrow range between $793 and $618 in the past week. It hit an intraday low of $696 and is currently trading around $704.
Overall bias remains bullish as long as support $640 holds. It trades above the 34 and 55 EMA on the 4-hour chart. Any close below $640 will drag the pair to $580/$550.
Immediate Resistance is at $725. A successful breakout above this resistance could suggest bullish momentum, with further gains possible towards $775/$812/$848/$1000.
Indicators (4-Hour Chart)
- Directional Movement Index: Neutral
- CCI (50): Bullish
Trading Strategy
Consider buying on dips around $650, with a stop-loss set at $600 and a target price of $1000.