


 Ether Breaks Below $2,100: Triple EMA “Sell-the-Rally” Setup Targets $1,900
  Ethereum Cracks Below $2,000 as Bitcoin Contagion Bites—Bearish EMA Stack Sets Sights on $1,700
  FxWirePro- Major Crypto levels and bias summary
  FxWirePro- Major Crypto levels and bias summary
  Bitcoin Buckles at $73,500: Middle East Tensions and Weak Institutional Demand Set Bearish EMA Stack on $70K Collision Course
  FxWirePro- Major Crypto levels and bias summary
  FxWirePro- Major Crypto levels and bias summary


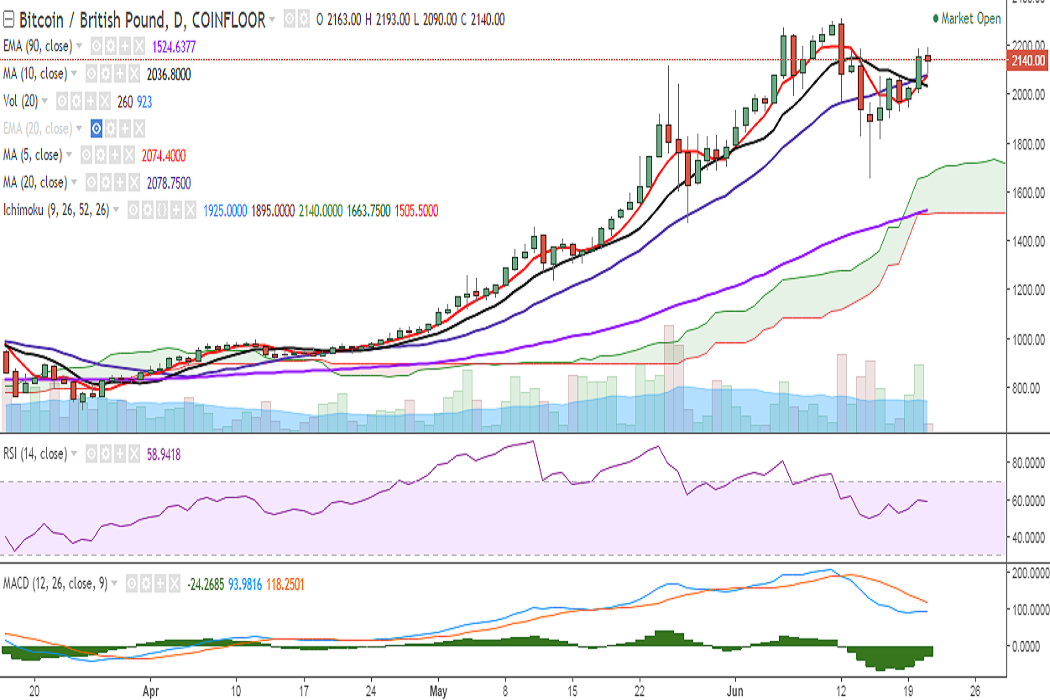
BTC/GBP successfully closed above 20-DMA on Tuesday and is now looking for a break above 2200 levels. It is currently trading 2153 levels at the time of writing (Coinfloor).
Ichimoku analysis of daily chart:
Tenkan Sen: 1925
Kijun Sen: 1895
On the upside, immediate resistance is seen at 2174 (78.6% retracement of 2315 and 1657) and a decisive break above would target 2200/2277 (June 06 high). Further strength would see the pair testing 2315 (June 12 high).
On the flipside, support is seen at 2079 (20-DMA) and a break below would target 2037 (10-DMA)/1970 (38.2% retracement of 1475 and 2277). Further weakness would drag it to 1876/ 1730 (50-DMA)/ 1657 (June 15 low).
Momentum studies: On the daily chart, RSI is strong at 58 and stochs suggest higher bias. The MACD line is below the signal line, however, the downward momentum appears to be fading.
On the 2-hour chart, the pair is holding above 200-SMA and a break below is likely to see a dip till 2044 (2h 50-SMA)/1976 (Lower Bollinger).
Overall bias remains bullish and a close above 2200 levels would see further upside in the pair. The current spinning top and narrowing of Bollinger bands suggest an upcoming change in trend.

- News

- Economy

- Central Banks
- Investing
- Research
- Roundups
- Digital Currency
- Insights
- Technical Analysis
- Technology
- Business
- Law
- Health
- Nature
- Fintech
- Science
- Topic
- Opinions
- ©Econometrics LLC . All Rights Reserved.
FxWirePro: BTC/GBP faces resistance at 2200, close above to see further upside
Wednesday, June 21, 2017 9:37 AM UTC
Editor's Picks


- Market Data
Most Popular


