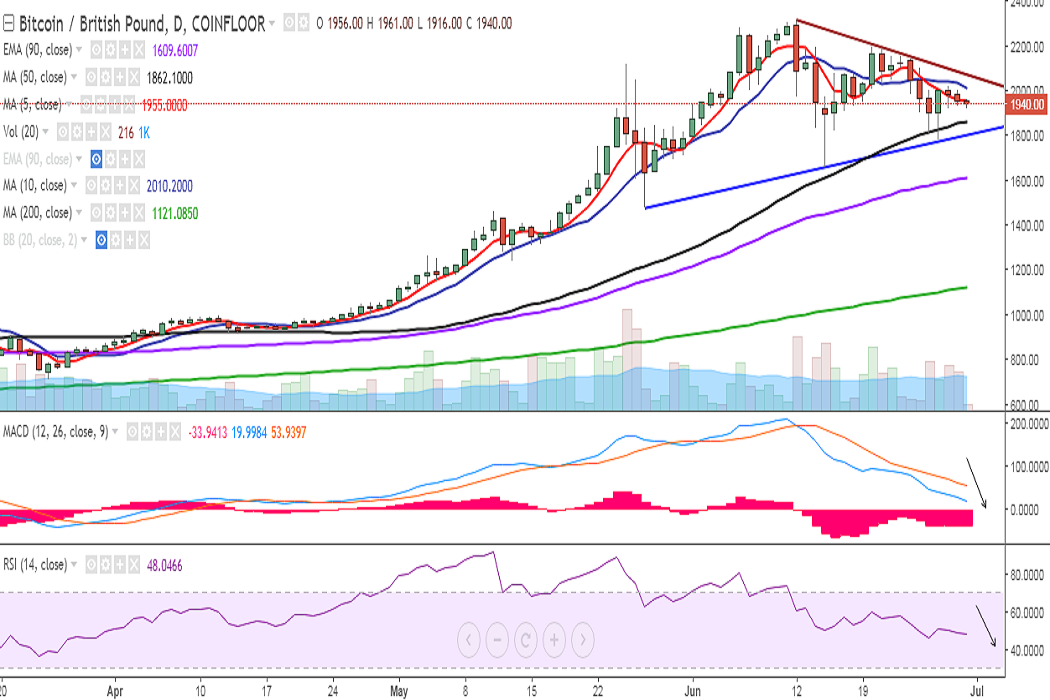
BTC/GBP continues trading in a very narrow range on Friday and is hovering around 5-DMA. It is currently trading at 1948 levels at the time of writing (Coinfloor).
Ichimoku analysis of daily chart:
Tenkan Sen: 1965
Kijun Sen: 1986
The pair is trading in a symmetric triangle pattern, with upside capped by strong trend line resistance and downside capped by trend line support.
On the upside, a break above 1955 (5-DMA) would see the pair testing 2011 (10-DMA)/2031 (20-DMA). Further strength would target 2070 (trend line joining 2315 and 2193)/ 2118 (May 25 high)/2174 (78.6% retracement of 2315 and 1657).
On the flipside, close below 1955 (5-DMA) would drag the pair to 1895 (50% retracement of 1475 and 2315)/1862 (50-DMA). Further weakness would see it testing 1797 (trend line joining 1475 and 1657)/1777 (June 27 low).
Momentum studies: Overall bias appears weak on the daily chart with RSI weak at 48, stochs biased lower, and the MACD line below the signal line.
On the weekly chart, RSI is at 72, MACD line is above the signal line, and stochs are on the verge of a rollover from the overbought zone. A close below 5-SMA, couple with the rollover of stochs and RSI from the overbought zone would confirm further bearishness in the pair.
Recommendation: Good to go short on close below 1955. SL: 2031. TP: 1895/1862.
FxWirePro launches Absolute Return Managed Program. For more details, visit http://www.fxwirepro.com/invest