FxWirePro: BTC/GBP takes support near 5-DMA, stay long
BTC/GBP hit a fresh all-time high of 1062 levels on 03 March 2017 and is currently trying to hold its strength above 5-DMA. It is trading at 1045 levels at the time of writing (Coinfloor). Ichimoku analysis of daily char…
By Shampa Mani
Updated 1 min read
Image from the original EconoTimes article
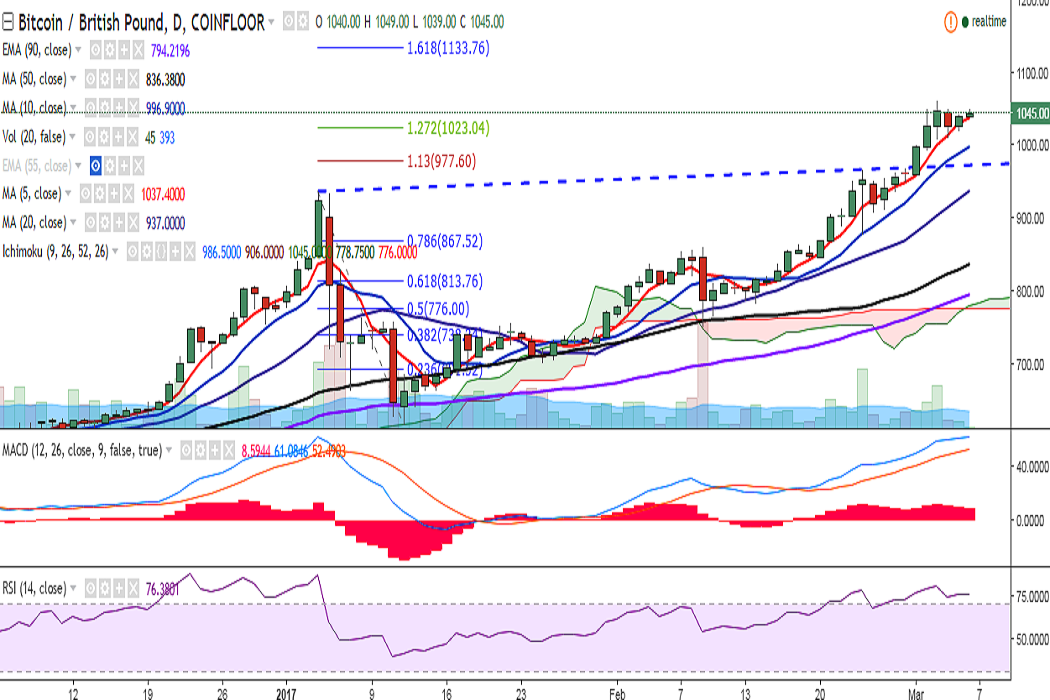
BTC/GBP hit a fresh all-time high of 1062 levels on 03 March 2017 and is currently trying to hold its strength above 5-DMA. It is trading at 1045 levels at the time of writing (Coinfloor).
Ichimoku analysis of daily chart:
Tenkan Sen: 985
Kijun Sen: 906
Momentum studies remain extremely bullish with no signs of reversal on daily charts. Resistance is now seen at 1062 (March 03 high) and a break above would see the pair soaring to 1100 (psychological)/ 1133 (161.8% retracement of 936 and 616).
Caution is advised as stochs and RSI(14) are in highly overbought zone. Watch out for a close below 1040 (5-DMA) for possibility of minor reversal.
Immediate support is seen at 1040 (5-DMA) and a break below would target 987 (10-DMA)/ 925.55 (20-DMA).
The combined position reached $1.084 million at its peak, $407,500 above the reported cost; the transfer does not show that the trader realized that difference.