FxWirePro: BTC/SGD trades higher, good to buy on dips
BTC/SGD is seen trading well above over the week, as seen on Friday. The pair has recovered from the low of 936.20 made in the previous week (ITBIT). It is currently trading around 1007.87 at the time of writing. Ichimok…
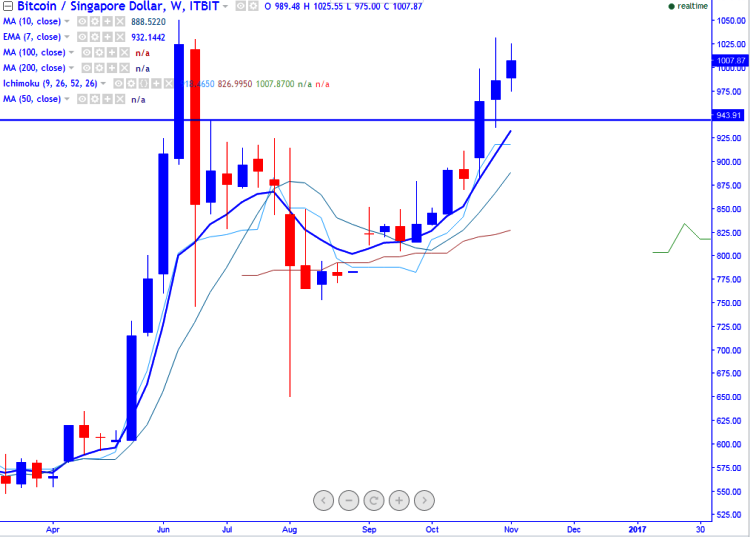
BTC/SGD is seen trading well above over the week, as seen on Friday. The pair has recovered from the low of 936.20 made in the previous week (ITBIT). It is currently trading around 1007.87 at the time of writing.
Ichimoku analysis of weekly chart shows:
Tenkan-Sen level: 918.46
Kijun-Sen level: 826.99
Trend reversal level - (7-W EMA) – 932
Long-term trend remains to be bullish. BTC/SGD faces strong resistance at 1032 and any break above targets 1051/1090 in the short term.
Major resistance is around 1031(161.8% retracement of 999 and 947) and any violation above will take the pair till 1051 (Jun 18th high)/1090 (161.8% retracement of 1031.92 and 936.20). Short-term support is seen at 980 (3-W EMA) and any break below targets 932 (7- W EMA)/888 (10- W EMA).