


 FxWirePro: GBP/USD dips as dollar firms ahead of key US economic data
  Bitcoin Tests Crucial $82K Support as $90K Breakout Looms
  BlackRock Sees AI Agents Fueling New Crypto Demand
  Aztec Revives zk.money for Private Ethereum Payments
  NZDJPY: Sell the Rallies — Bearish EMAs Stack Up as Yen Sellers Eye a Slide to 87
  Binance Pay Goes Live at PayPay Merchants in Japan
  Strategy Buys 1,665 Bitcoin as BTC Holdings Reach 847,666
  Cboe Extends SPX Options Deal, Eyes Tokenized Contracts
  FxWirePro- Major Crypto levels and bias summary
  Bitwise Launches NEAR ETF as $562 Bull Case Fuels AI Crypto Buzz
  Bitcoin Futures Open Interest Plunges 49,000 BTC in Biggest Drop Since 2025
  Robinhood Chain Meme Coins Slide as Stock Token Locks Rise
  QNT Whales Move $10M to Exchanges After 400% Rally
  FxWirePro- Major Crypto levels and bias summary
  GBPJPY's Fade After the Peak": Pullback From 206.88 Low — Sell Rallies at 208.78-80, Target 207
  Major Pair Currency Score: EURUSD, GBPUSD, NZDUSD & AUDUSD "Bearish" — USDCAD & USDCHF "Bullish" Pairs to Watch


 Add as a preferred source on Google
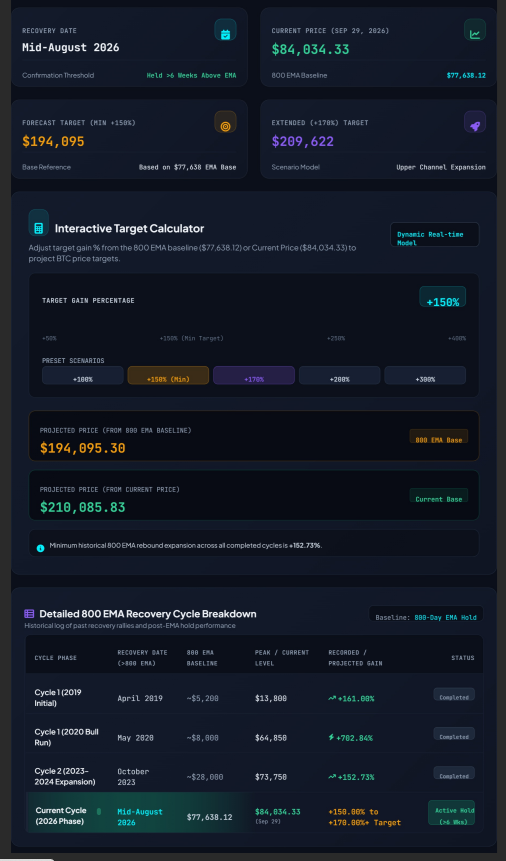
Historical 800 EMA Reclaims Signal Regime Shifts
A historical analysis of daily BTC/USD price action shows that it takes a full week for Bitcoin to recover and close above the 800-period Exponential Moving Average (EMA) for confirmation. It was historically associated with remarkable multi-hundred-percent rallies in BTC/USD price. For instance, it triggered an initial +161.00% surge in April 2019, a massive +702.84% macro expansion after the May 2020 post-COVID reclaim, and a +152.73% advance during the October 2023 recovery that drove prices from ~$28,000 to over $73,700.
Current Validation and Support Baseline
After temporarily dropping below the 800-day EMA in mid-2026, Bitcoin officially completed its recovery above the key baseline in mid-August 2026. As of September 29, 2026, Bitcoin has been above this level for over six consecutive weeks and is trading at $84,034.33 against the 800 EMA baseline of $77,638.12. This consolidation above the moving average confirms the macro bullish continuation pattern, setting $77,638 as a support zone for the ongoing cycle leg.
Macro Target Forecast and Upside Price Projections
Using the historical minimum expansion benchmark of +150% of the $77,638 breakout baseline establishes a conservative minimum price target model of $194,000 to $200,000+. Should the current rally align with stronger historical cycle expansions (+160% to +170%+), Bitcoin is projected to comfortably extend into the $205,000 to $210,000+ price channel during this expansionary phase.







