


 FxWirePro- Major Crypto levels and bias summary


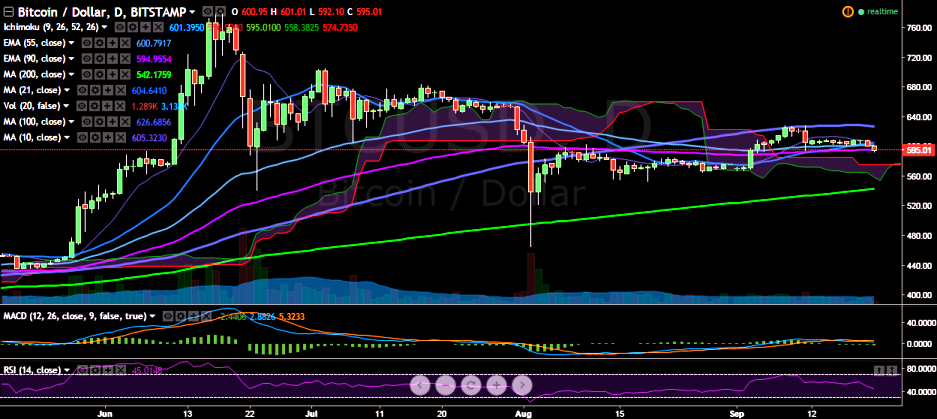
BTC/USD has slipped below the 600.00 mark, failing to break above 10 DMA. The pair has sharply declined after hitting 609 levels and is currently trading at 594 levels (Bitstamp).
Long-term trend: Bullish
Short-term trend: Bearish
Ichimoku analysis of daily chart:
Tenkan Sen: 605.84
Kijun Sen: 596.90
Trend reversal: 594.95 (90 EMA)
“The pair briefly broke below 90-EMA and has hit a fresh low of 592.10 on Wednesday. The pair is also trading below both Tenkan Sen and Kijun Sen, suggesting scope for further downside. A dip till 550 is likely”, FxWirePro said in a statement.
Major resistance is seen at 603 levels (21-day MA) and a break above would target 610 levels (psychological)/ 628 (September 11 high).
On the flip side, the pair will now find support at 566 (38.2% retracement of 465.28 and 628.99) and a break below would drag it to 550/541 (200-day MA).

- News

- Economy

- Central Banks
- Investing
- Research
- Roundups
- Digital Currency
- Insights
- Technical Analysis
- Technology
- Business
- Law
- Health
- Nature
- Fintech
- Science
- Topic
- Opinions
- ©Econometrics LLC . All Rights Reserved.
FxWirePro: BTC/USD breaks below 600, good to sell on rallies
Wednesday, September 21, 2016 7:26 AM UTC
Editor's Picks


- Market Data
Most Popular


