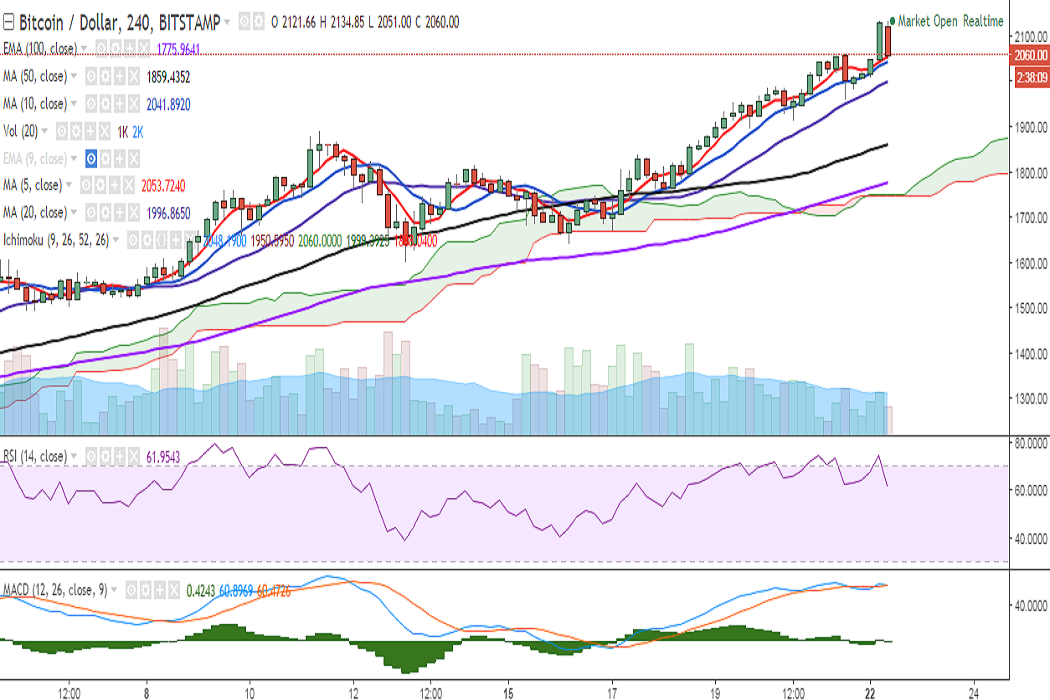
BTC/USD trades higher on Monday and has hit a fresh all-time high at 2134.86 levels so far in the day. It is currently trading at 2055 levels at the time of writing (Bitstamp).
Ichimoku analysis of daily chart:
Tenkan Sen: 1888
Kijun Sen: 1709.93
On the upside, if the pair closes above 2100 levels (psychological), it would target 2134.86 (today’s high)/2164.18 (127.2% extension of 891.33 and 1892)/2200 (psychological).
On the 1-hour chart, the pair has broken below 5-SMA and hovering around 2100 levels. On the 4-hour chart, it is likely to find support near 2041 (4h 10-SMA) and a break below could see a dip till 1996 (4h 20-SMA). Further weakness could target 1859 (4h 50-SMA), which could see further downside in the pair.
On the daily chart, support is seen at 1990 (5-DMA) and any violation would target 1931 (38.2% retracement of 1601.46 and 2134.86)/1869 (10-DMA).
Caution is advised as stochs and RSI are in the overbought zone.