


 FxWirePro: EUR/AUD regains upwards momentum but unable to hold above 50%fib level
  FxWirePro : GBP/NZD strongly bearish despite upside attempts
  FxWirePro: GBP/AUD drifts lower after BOE rate decision
  FxWirePro- Major Pair levels and bias summary
  FxWirePro:EUR/NZD gains some upside momentum but still bearish
  FxWirePro: USD/ZAR firms ahead of Fed interest rate decision
  FxWirePro: GBP/NZD remains weak, eyes 38.2%fib support
  Buy the Dips on EUR/JPY: Bullish Structure Points to 188 Target Ahead of Fed
  FxWirePro: USD/JPY edges higher as focus shifts to BOJ decision
  FxWirePro: GBP/USD rises as soft US data pressures dollar
  FxWirePro- Major Pair levels and bias summary
  FxWirePro: USD/CAD slips after Fed holds rates steady
  Nikkei Surges Past 65,000 on Suspected Yen Weakness: Tech Giants Like Advantest and NEC Lead Explosive Gains
  FxWirePro: USD/ CNY hits one-month low,scope for futher downside
  FxWirePro- Woodies pivot (Major)
  FxWirePro: AUD/USD dips below lower range, bearish bias increases


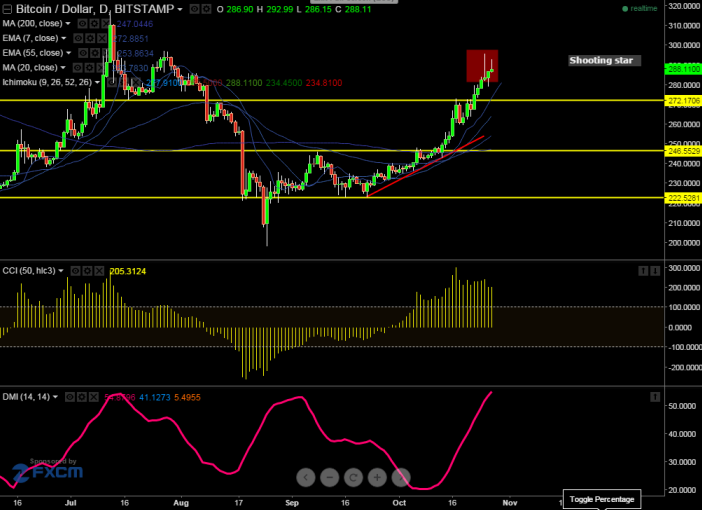
- BTC/USD has made a high of $296 and started to decline from that level. Short term trend is bearish as long as resistance $300 holds
- The pair's minor support is around $277 and any break below will drag the pair further down till $269/$258.
- On the higher side any break above $300 will take the pair till $310/$317.
Indicator (Daily chart)
CCI (50) -Buy
Ichimoku- Buy
We prefer to sell on rallies around $290-92 with SL at $300 for the TP of $277/$268.


