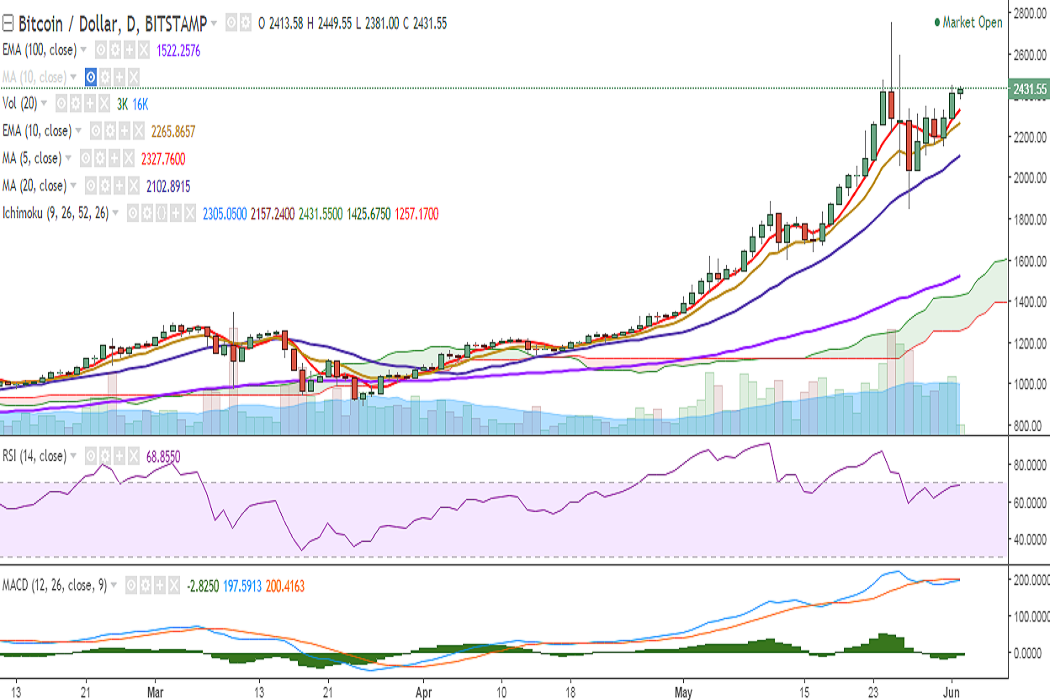
BTC/USD is trading in a very narrow range on Friday after it hit 2456 levels on June 01. It is currently trading at 2431 levels at the time of writing (Bitstamp). Ichimoku analysis of daily chart: Tenkan Sen: 2305.05 Kij…
By Shampa Mani
Updated 1 min read
Image from the original EconoTimes article
BTC/USD is trading in a very narrow range on Friday after it hit 2456 levels on June 01. It is currently trading at 2431 levels at the time of writing (Bitstamp).
Ichimoku analysis of daily chart:
Tenkan Sen: 2305.05
Kijun Sen: 2157.24
On the upside, a close above 2456 (June 01 high) would see the pair testing 2510 (161.8% extension of 891.33 and 1892)/2565 (78.6% retracement of 2760 and 1850)/2600.
Momentum studies appear bullish with RSI holding at 68 and stochs showing higher bias on the daily chart.
On the 4-hour chart, the pair is holding above 2399 (4h 10-SMA) and a break below would drag it to 2304 (4h 50-SMA)/2188 (4h 90-EMA).
On the 2-hour chart, 2162 (2h 200-SMA) is a major support and a break below would see further downside in the pair.
The Ripple-commissioned analysis connects custody with services such as payments, tokenization and stablecoin issuance, but gives no timeframe for the modeled gain.