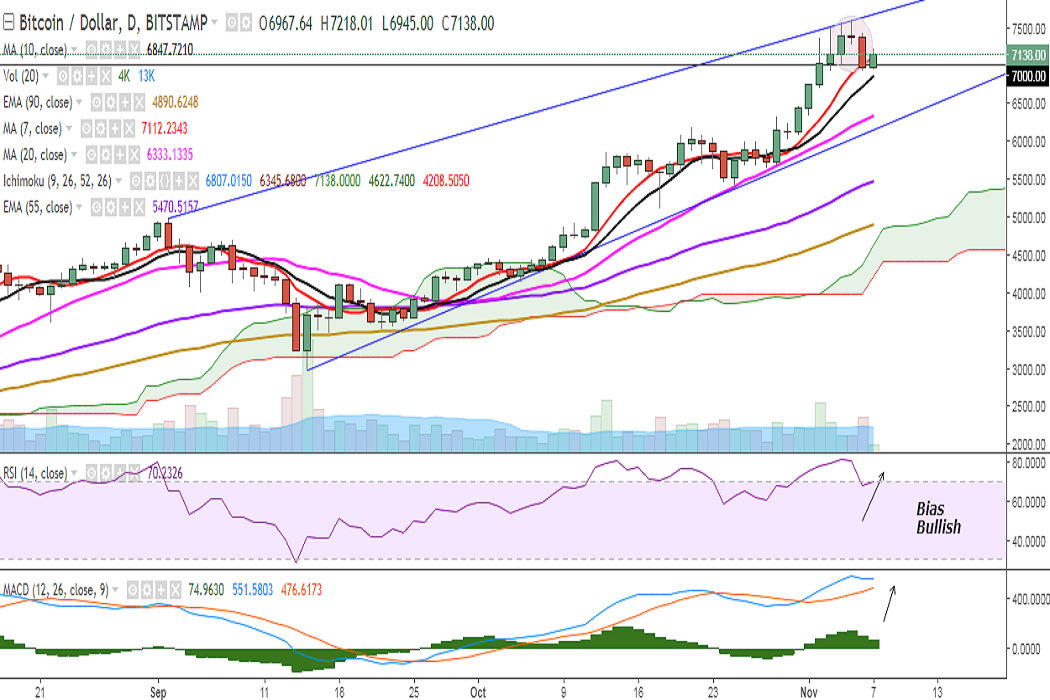
BTC/USD dropped to 6922 levels on Monday, forming a shooting star. It is currently trading at 7138 levels at the time of writing (Bitstamp).
Ichimoku analysis of daily chart:
Tenkan Sen: 6807.01
Kijun Sen: 6345.68
On the upside, resistance is seen at 7300 (4h 20-SMA) and a break above would target 7511 (2h Upper Bollinger)/7678 (trend line joining 4979.90 and 7590)/7700.
On the downside, support is seen at 6855 (10-DMA) and any violation would drag it to 6500 (23.6% retracement of 2972.01 and 7590)/6336 (20-DMA)/6147 (trend line joining 2972.01 and 5366).
Momentum studies: Bias remains bullish on the daily chart with RSI strong at 70, MACD line above the signal line, and major moving averages biased higher. However, the shooting start formation calls for high caution.
Some weakness could be seen on the intraday charts. On the 4h chart, 10-DMA is biased lower and capping the price action, RSI is at 49 and MACD line is below the signal line.
A break below 10-DMA will see further downside in the pair.
FxWirePro launches Absolute Return Managed Program. For more details, visit http://www.fxwirepro.com/invest