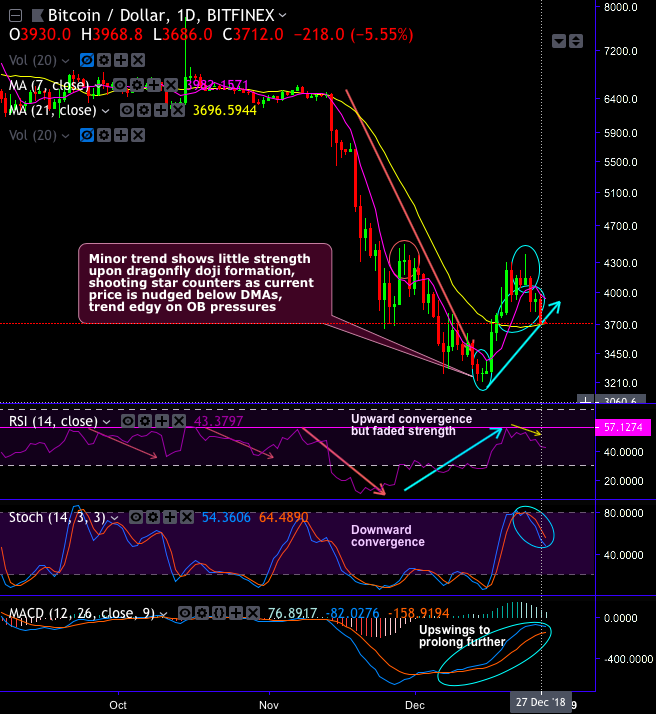
BTCUSD price has slid below $3,708 levels (i.e. 21-DMAs), but for today, the trend has been drifting in sideways amid Christmas holiday season.
Technically, the minor trend of this pair shows little strength especially upon dragonfly doji formation at $3,283.40 levels on 15thDecember, ever since then rallies take-off and bounced back above 7 & 21-DMA levels. In this holiday season of Christmas and New Year bears counter back with shooting star pattern at $4,140.7 levels, consequently, we’ve seen slumps below 7DMAs during Christmas festival season, trend, for today, seems to be little edgy on overbought pressures signalled by the leading oscillators. Both RSI and stochastic curves show faded strength in previous bullish swings. As a result, you could easily make out that the daily trend drifts in sideways.
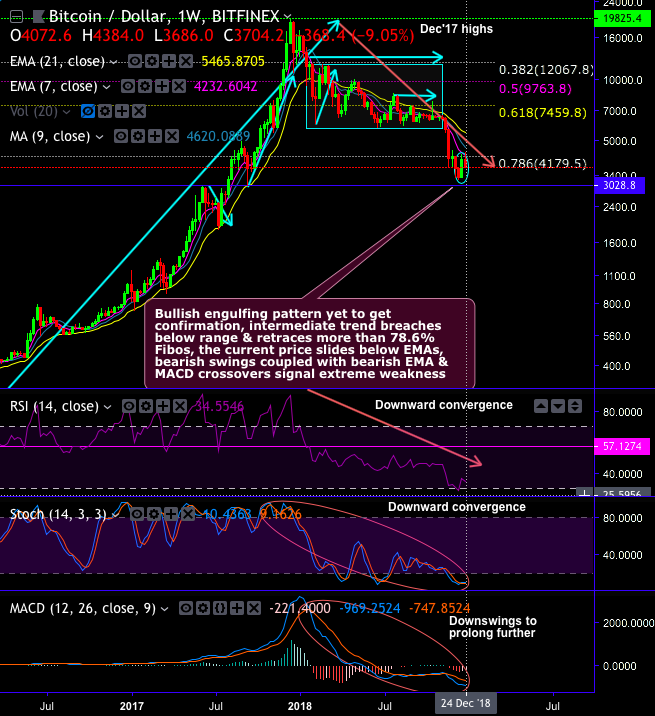
On the flip side, the bullish engulfing pattern has occurred last week at $4,071 levels which is yet to get confirmation from the technical indicators, while the intermediate trend breaches below range & retraces more than 78.6% Fibonacci levels, the current price slides below EMAs.
Well, overall, the technical charts of short-term plotting indicate quite bullish price sentiments comparatively contemplating both the trend indicators. DMA and MACD show bullish crossovers that signal upswings likely to prolong further after holiday season. We wish all our dear readers a very prosperous new year with constructive news from the cryptocurrency space.
At spot reference: 3704 levels, on trading grounds, one can initiate BTCUSD boundary option spread strategy with upper strikes at 3900 and lower strikes at 3515 levels.
The trading between these strikes likely to derive certain yields in this perplexed trend in the short term, more importantly, these yields are exponential from spot movements.
For cash or nothing, these options would be exercised if the forward prices to remain between both strikes (i.e. 3900 > Fwd price > 3515 levels).
Alternatively, one could initiate long positions in CME BTC futures contracts of near month tenors with a view of arresting upside risks.
Currency Strength Index: FxWirePro's hourly BTC spot index is inching towards -106 levels (which is bearish), while hourly USD spot index was at 37 (mildly bullish) while articulating (at 07:00 GMT).
For more details on the index, please refer below weblink: http://www.fxwirepro.com/currencyindex