


 FxWirePro- Woodies pivot (Major)
  FxWirePro: GBP/AUD runs out of steam but maintains bullish outlook
  Peace Dividend Powers NZDJPY Past 93.50 — Bulls Set Sights on 96.15 Target
  BTC’s Bear Bounce: Sell the Rally Near $66K as Bears Target $59K–$52K Breakdown
  FxWirePro- Major Pair levels and bias summary
  Relief Rally Extends to 112.75, but AUDJPY EMA Structure Favors Selling
  FxWirePro: AUD/ USD strongly bearish despite upside attempts
  FxWirePro: USD/CAD steadies around 1.3990 ,retains bid one
  FxWirePro- Major Crypto levels and bias summary
  FxWirePro- Woodies pivot (Major)
  FxWirePro: GBP/NZD stuck in range but outlook is bullish
  FxWirePro: USD/ CNY falls towards 6.750, bears keep the advantage
  GBPJPY Coil Tightens: Is a Bullish Break Above 215.60 Imminent?


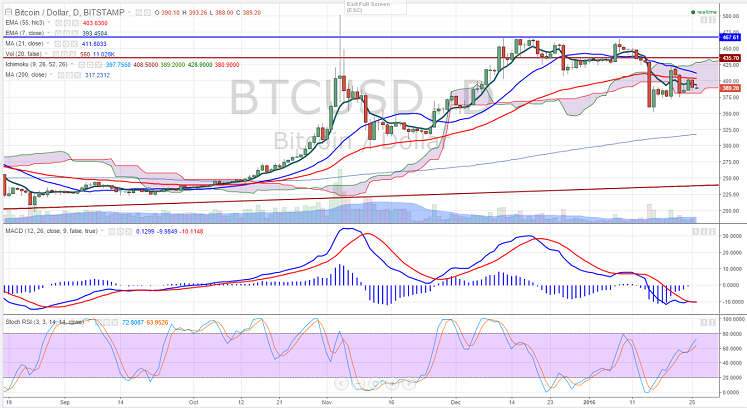
- BTC/USD has made a high of $405 yesterday and slightly declined from that level. It is currently trading around $392.
- Short term trend is bullish as long as support $370 holds.On the lower side any break below $370 will drag the pair down till $350/$315 (200 day MA).
- The pair's resistance is around $405 and break above will take the pair to next level $425/$450/$466.
- Overall bullish invalidation below $315 (200 day MA).
- Momentum indicator Stoch RSI - Buy- Buy
It is good to buy at dips around $390-395 with SL around $370 for the TP of $450/$465


