


 J.P. Morgan Sees Potential Vestas Guidance Upgrade Amid Strong Wind Energy Demand
  Gold's 365-Day EMA Streak Since Oct 2023 Faces Its First Real Test at $3,980 — Break or Bounce to $4,140?
  AI Memory Boom Sparks Global Chip Supply Crunch
  Morgan Stanley Sees Chinese Auto Market Recovery Gaining Momentum in Late Summer
  How AI prompting turned writerly description into an everyday skill
  Trump’s Iran Strategy: What Has Been Achieved After Three Months of Conflict?
  Gold Surges Above Key EMAs, Bulls Eye Resistance Amidst Bullish Momentum
  Silver Cracks Key 365-Day EMA for First Time Since Feb 2024; Bears Eye $50 on Rallies
  China’s AI Manufacturing Boom Masks Weak Consumer Economy, Citi Says
  Goldman Sachs: US Dollar Likely to Stay Strong Despite Oil Price Retreat
  With Iran and the US signing a peace deal, where does that leave Benjamin Netanyahu?


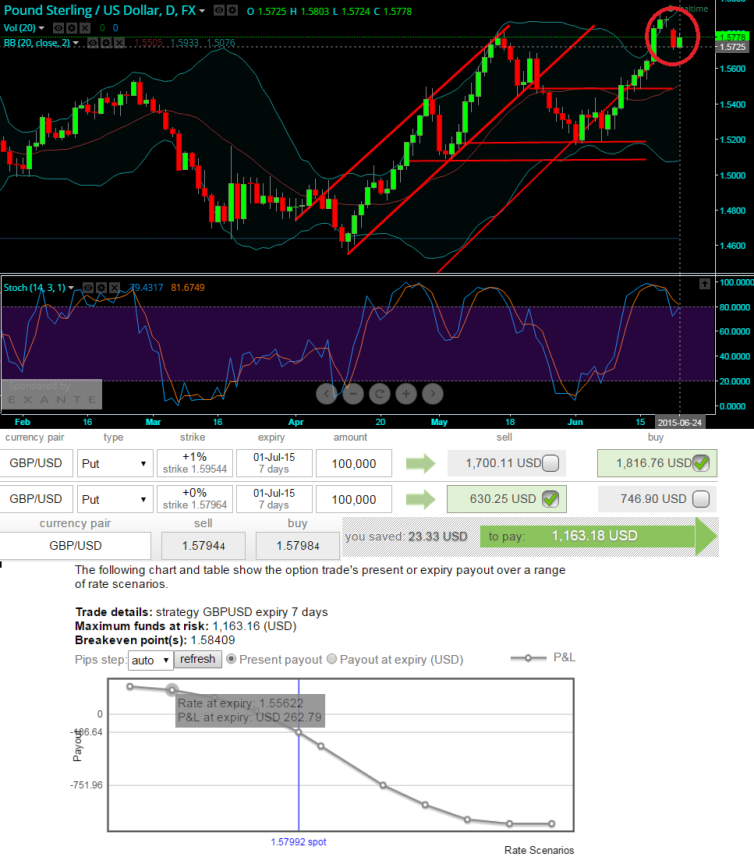
On daily charts of GBP/USD candlestick gap occurred at 1.5725 levels to signal probable weakness in this pair. It is deemed as a break away as it occurs at the end of an important price pattern (exactly at the peaks) and signifies beginning of an important market move.
The breaking of an important resistance at 1.5822 levels through a breakaway gap would be a solid confirmation of beginning of major and steep downward move.
The breakaway gap occurs with heavy volumes as well and in case it fills in within no time then bearish momentum would not be sustained.
Slow stochastic in addition is signaling oversold pressure as %D line cross over exactly above 80 levels. (Currently %D line at 82.1711 & %K line at 80.9202).
With bearish consciousness we would like to recommend bear put spreads at this juncture for hedging reasons.
Option Hedging Recommendations:
Hence, buy 15D (1%) In-The-Money put option and sell (-1%) Out-Of-The-Money put option with similar maturity.
By shorting the out-of-the-money put, the options trader reduces the cost of establishing the bearish position but forgoes the chance of making a large profit in the event that the underlying asset price plummets.

- News

- Economy

- Central Banks
- Investing
- Research
- Roundups
- Digital Currency
- Insights
- Technical Analysis
- Technology
- Business
- Law
- Health
- Nature
- Fintech
- Science
- Topic
- Opinions
- ©Econometrics LLC . All Rights Reserved.
FxWirePro: Break away gap on GBP/USD daily charts, Are slides underway?
Wednesday, June 24, 2015 10:11 AM UTC
Editor's Picks


- Market Data
Most Popular


