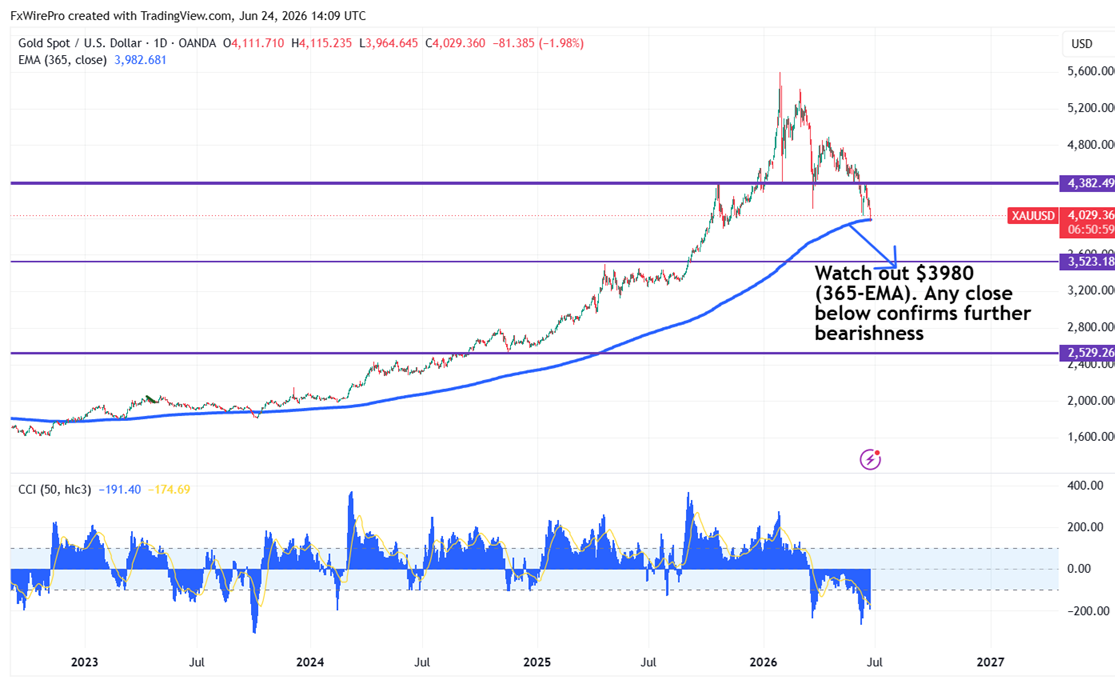
Since October 17, 2023, gold has had a consistent price over its 365-day EMA; that support level is currently close to $3,980, the most important line in the sand for the present structure. A definitive daily close under $3,980 would indicate a historic break of this moving average and signal more bearish continuation, therefore exposing downward objectives at $3,886, $3,800, and $3,718 in sequence. For high-risk traders looking to try a countertrend long, the setup provides a tight entry with a stop close to $4,000 and a hard stop-loss set just under today's low of around $3,960, targeting a recovery between $4,140 and $4,145 should buyers effectively reclaim and hold the broken support zone.