


 NZDJPY Pulls Back on Kiwi Weakness: Buy Dips at 94.40 Targeting 97
  FxWirePro- Major Pair levels and bias summary
  Major Crypto Action Bias: ETHUSD Turns Bullish – Only Bullish Pair to Watch
  AUDJPY Pulls Back on Profit Booking: Buy Dips Toward 117/118
  FxWirePro:USD/JPY hovers near 40-year peak,intervention fears linger
  FxWirePro: EUR/ AUD dips below 1.6300 level, focus on near term support
  FxWirePro: EUR/ AUD downtrend loses steam, remains on bearish path
  JPY Strength Alert: USDJPY, AUDJPY, EURJPY and CADJPY Turn Extremely Bullish
  Major Pair Action Bias: USDCHF Turns Bullish as EURUSD Stays Bearish – Key Pairs to Watch
  FxWirePro: GBP/USD stays below 1.3400 level following cooler inflation report
  FxWirePro: GBP/NZD gains some upside momentum but still bearish
  FxWirePro: USD/CNY attracts selling interest, vulnerable to more downside
  FxWirePro: AUD/USD rallies on jobs surge, heads to test key resistance
  JPY Action Bias: USDJPY, AUDJPY & EURJPY Turn Extremely Bullish – Top Pairs to Watch
  FxWirePro- Major Pair levels and bias summary
  FxWirePro:NZD/USD edges higher as kiwi firms on hawkish RBNZ outlook


 - EconoTimes)


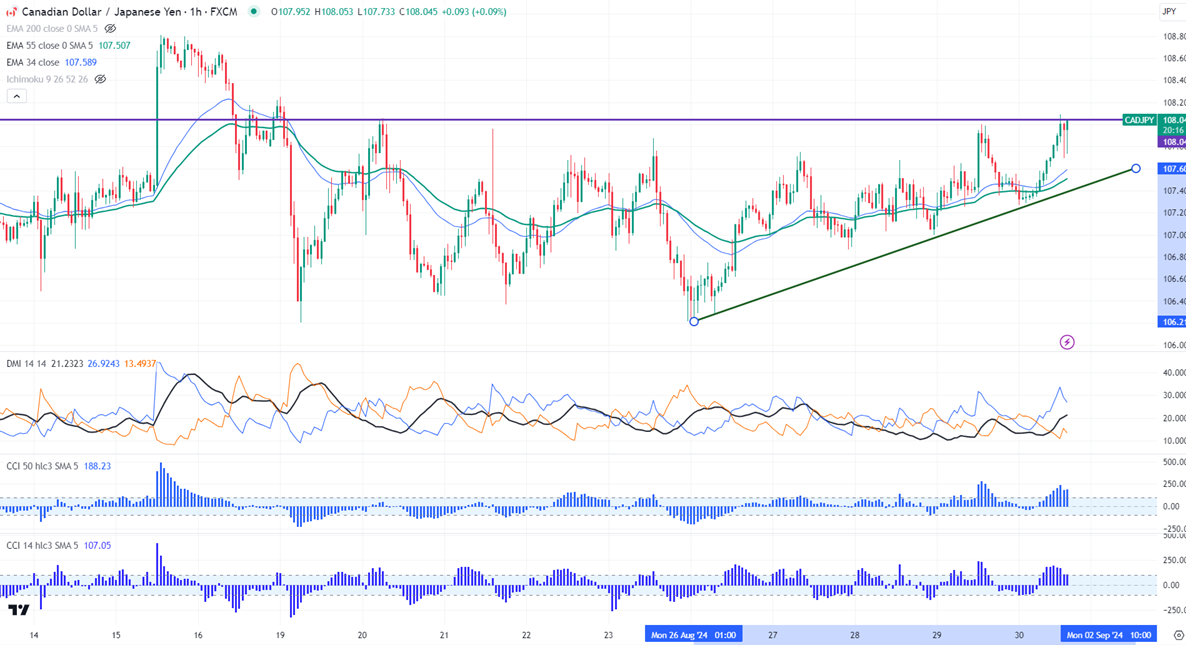
CADJPY showed a nice jump after upbeat Canadian GDP data. It hit a high of 108.80 and is currently trading around 107.99.
The economy rose to 0.50% y/y in Q1 in line with expectations from Q1 0.40%. the yearly GDP grew 2.1% in the Q2 ,well above estimate of 1.6%.
Technicals-
The pair trades above 34- and 55 EMA in the hourly chart.
The near-term resistance is around 108, a breach above targets 108.80/109.20/110. The immediate support is at 107.65, any violation below will drag the pair to 107.20/109.90.
Indicator (hourly chart)
CCI (14)- Bullish
CCI (50)- Bullish
Average directional movement Index- bullish. All indicators confirm a bullish trend.
It is good to buy on dips around 107.97-108 with SL around 107.48 for a TP of 108.80/109.25.


