


 S&P 500 Surges Ahead of Trump Inauguration as Markets Rally
  Home ownership is slipping out of reach. It’s time to rethink our fear of ‘forever renting’
  Insignia Financial Shares Hit 3-Year High Amid Bain and CC Capital Bidding War
  SoftBank Eyes Up to $25B OpenAI Investment Amid AI Boom
  AUDJPY Under Pressure: US Dollar Strength and Bearish Technicals Signal Further Declines
  How the UK’s rollback of banking regulations could risk another financial crisis
  EURJPY Consolidates Above Key EMAs: Mixed Indicators Suggest Cautious Optimism for Traders
  Why your retirement fund might soon include cryptocurrency
  NZDJPY: Bearish Outlook Persists as 92 Resistance Holds Firm
  FxWirePro: GBP/USD neutral in the near-term, scope for downward resumption
  Wall Street Rebounds as Investors Eye Tariff Uncertainty, Jobs Report
  FxWirePro- Major Pair levels and bias summary
  Ferrari Group to Launch IPO in Amsterdam, Targets Over $1 Billion Valuation
  FxWirePro: EUR/AUD up trend gains momentum but hurdles ahead
  GBPJPY Surges Past Trendline Resistance, Signaling Bullish Momentum
  GBPJPY Caught in a Tight Range: Bearish EMAs Suggest a Breakout Awaits
  UK Markets Face Rising Volatility as Hedge Funds Target Pound and Gilts


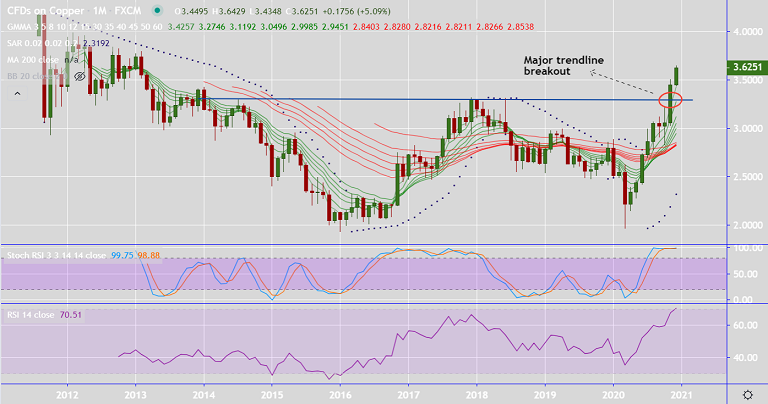
COPPER chart - Trading View
Copper was trading 0.38% higher on the day at 3.624 at around 09:45 GMT.
The pair is extending previous month's stellar performance and has gained over 5% on the month till date.
Bullish bias boosted after price action broke major trendline resistance at 3.30 in the previous month's trade.
The pair is extending bull run for the 7th straight week, price has hit levels unseen since Feb 2013.
Technical indicators are bullishly aligned, keeping scope for further upside. No major signs of exhaustion seen.
Overbought oscillators raise possibility of minor downside. Pullbacks are likely to be shallow. Bullish invalidation only below daily cloud.


