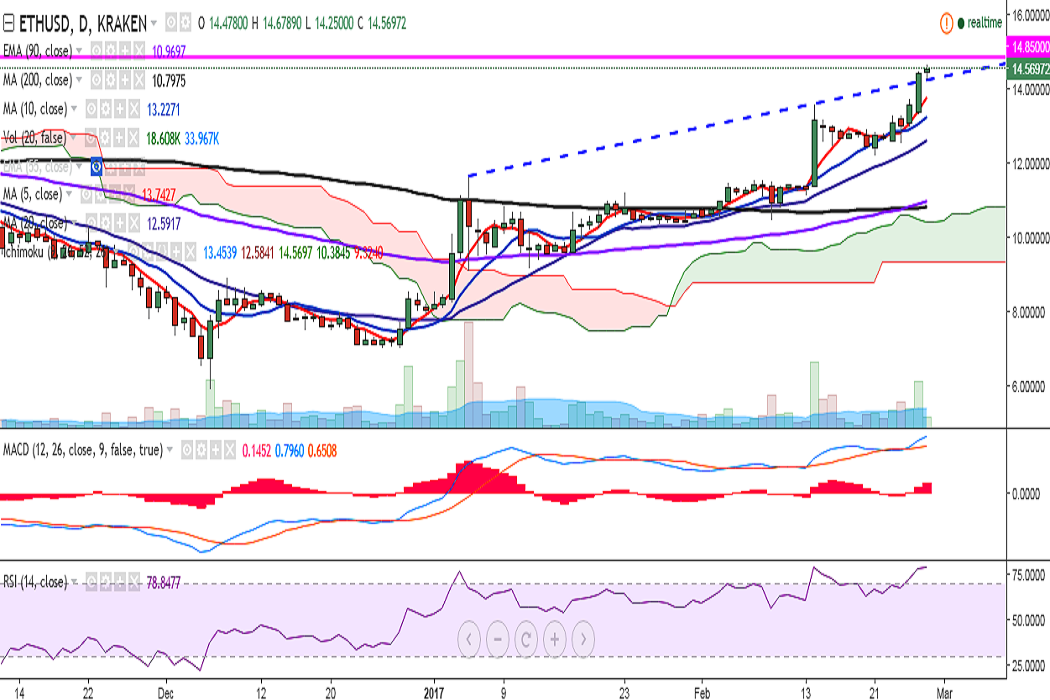
After trading rangebound for a number of days, ETH/USD broke above major trend line resistance on February 26 and is currently trading at 14.50 levels (Kraken).
Ichimoku analysis (Daily chart):
Tenkan-Sen: 13.34
Kijun-Sen: 12.47
Although overall trend appears bullish, traders are preferred to be cautious as Stochs and RSI(14) are in overbought zone.
The price movement seems to have formed a flag pattern, suggesting that we could see some consolidation at current levels with bullish bias.
On the upside, resistance is now seen at 14.85 (20 May 2016 high) and a break above would target 15 (psychological)/15.23 (22 July 2016 high).
In the daily chart, support is seen at 14.25 (trend line joining 11.63 and 13.58) and any violation would drag it to 13.36 (5-DMA)/13.04 (10-DMA).