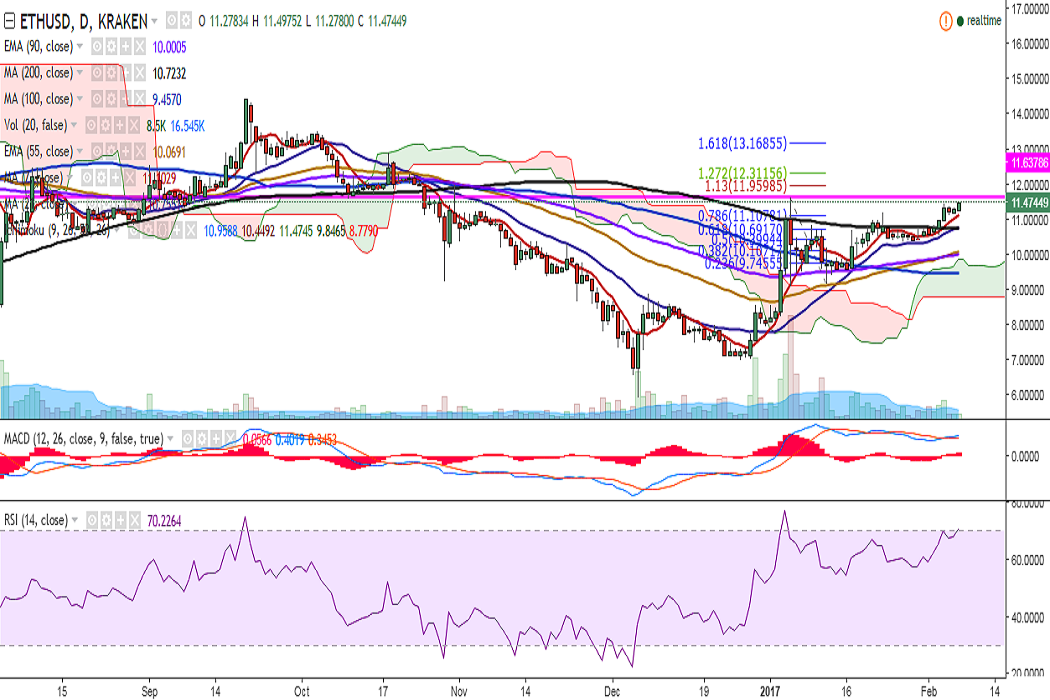
ETH/USD moved further north on Tuesday and hit 11.49 levels so far in the day. It is currently trading at 11.47 levels at the time of writing (Kraken).
Ichimoku analysis (Daily chart):
Tenkan-Sen: 10.93
Kijun-Sen: 10.31
Trend reversal: 10.73 (200-DMA)
On the upside, immediate resistance is seen at 11.50 levels (psychological) and a consistent break above would see the pair testing 11.63 (January 05 high)/11.95 (78.6% retracement of 11.63 and 9.19)/12 (31 October 2016 high).
Momentum studies remain bullish, RSI(14) is strong at 70; MACD line is above signal line. Also, the pair is successfully holding above 7-DMA.
On the flip side, the pair is likely to find support near 10.98 (7-DMA) and any violation would drag it to 10.73 (200-DMA)/10.38 (January 27 low).