


 FxWirePro-24-Hour Crypto Category-Based Performance Dashboard
  Bitcoin Surges Past $85,000 Amidst Rising Risk Appetite
  FxWirePro- Major Crypto levels and bias summary
  Crypto Alpha Command: BTC & ETH derivatives Intelligence


 Add as a preferred source on Google
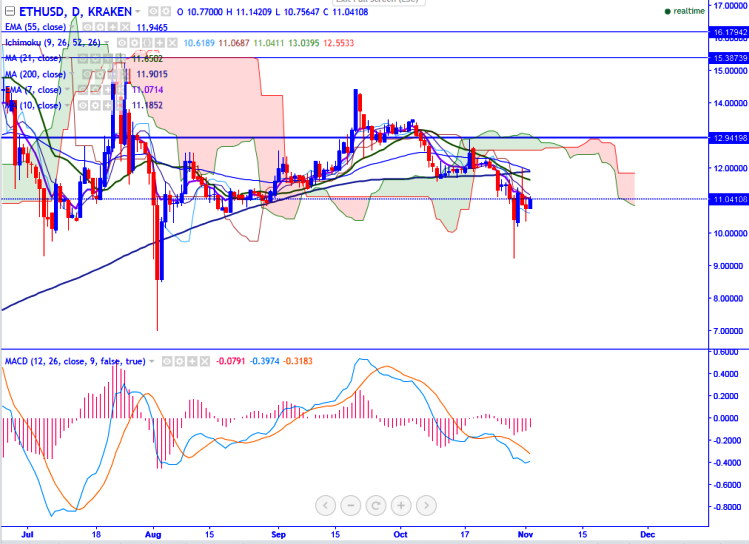
ETH/USD is trading in narrow range between $12 and $9.23 for the past four trading sessions (KRAKEN). It is currently trading around $11.04 at the time of writing.
Ichimoku analysis of daily chart shows:
Tenkan-Sen $10.75
Kijun-Sen $11.22
Trend reversal - $11.95 (100 day MA)
Long-term trend remains to be neutral. In the daily chart, the pair is facing strong resistance at $12 and a slight upside is possible only above that level.
Major resistance - $11.28 (10- day MA) and any break above targets $11.68 (21- day MA)/$11.98 (55- day MA). Major support - $10.75 (daily Tenkan-Sen) and break below targets $10.29 (61.8% retracement of $9.23 and $12)/$9.23 (Oct 29th low).

- News

- Economy

- Central Banks
- Investing
- Research
- Roundups
- Digital Currency
- Insights
- Technical Analysis
- Technology
- Business
- Law
- Health
- Nature
- Fintech
- Science
- Topic
- Opinions
- ©Econometrics LLC . All Rights Reserved.
FxWirePro: ETH/USD faces strong resistance around $12 level, good to sell on rallies
Wednesday, November 2, 2016 10:29 AM UTC
Editor's Picks



- Market Data
Most Popular




