Consecutive doji formations are seen in ETH/USD, signaling indecisiveness in the market. It is currently trading at 10.35 levels at press time (Kraken). Ichimoku analysis (Daily chart): Tenkan-Sen: 9.93 Kijun-Sen: 9.32 U…
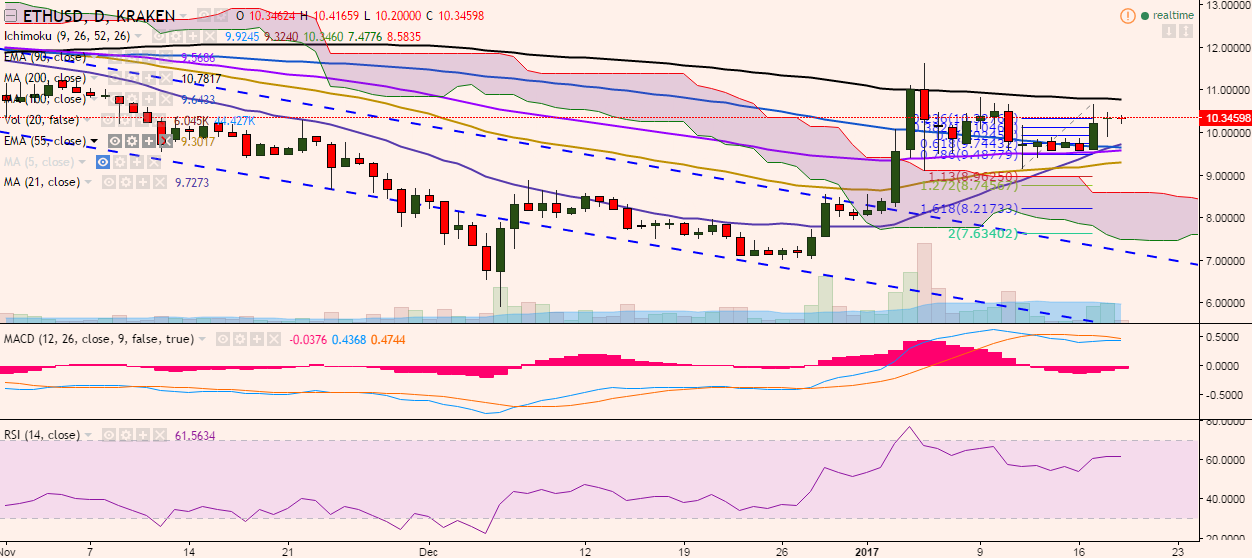
Consecutive doji formations are seen in ETH/USD, signaling indecisiveness in the market. It is currently trading at 10.35 levels at press time (Kraken).
Ichimoku analysis (Daily chart):
Tenkan-Sen: 9.93
Kijun-Sen: 9.32
Upward bias is seen in the pair despite back to back dogi formations. It faces strong resistance at 10.78 (200-DMA) and a consistent break above would see further jump till 11.09 (78.6% retracement of 11.63 and 9.16)/11.63 (January 05 high).
On the flip side, the pair is likely to find support near 9.63 (21-DMA) and any violation would target 9.26 (55-EMA)/8.96 (113% retracement of 9.16 and 10.68).