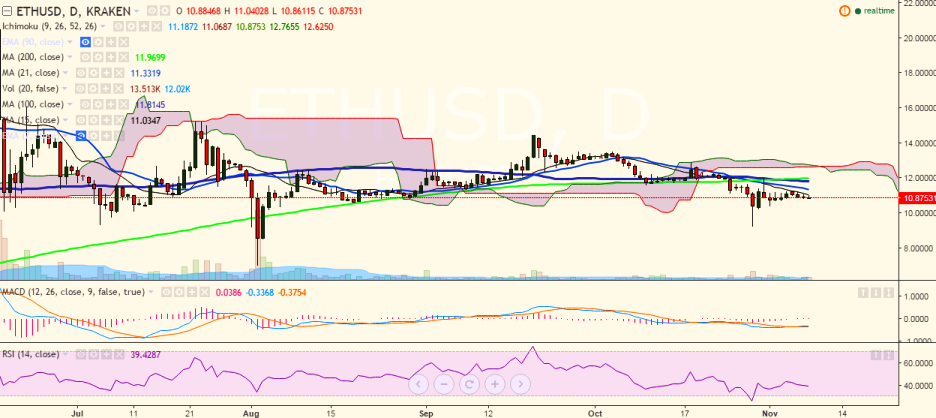
FxWirePro: ETH/USD struggles to break above 15-DMA, good to sell on rallies
ETH/USD is facing strong resistance at 11.10 (15-day MA) and is struggling for a consistent break above this level. It is currently trading at 10.87 levels (Kraken). Short-term trend: Bearish Long-term trend: Bearish Ich…
ETH/USD is facing strong resistance at 11.10 (15-day MA) and is struggling for a consistent break above this level. It is currently trading at 10.87 levels (Kraken).
Short-term trend: Bearish
Long-term trend: Bearish
Ichimoku analysis (Daily chart):
Tenkan-Sen: 11.10
Kijun-Sen: 11.06
Trend reversal: 11.82 (100 day MA)
The pair’s faces immediate resistance at 11.10 (15-day MA) and a break above would see it testing 11.23 (38.2% 14.45 and 9.23)/11.82 (100- day MA)/12 (31st Oct high).
On the other hand, support is seen at 10.61 (50% retracement of 9.23 and 12) and any breach will drag it to 10.27 (61.8% retracement of 9.23 and 12)/9.23 (Oct 29 low).