


 FxWirePro: USD/CNY dips as yuan firms on improving risk appetite
  NZDJPY Action Bias: Bullish Dip-Buying Opportunity on Broad Yen Weakness
  FxWirePro :USD/JPY eases slightly, remains on bullish path
  FxWirePro- Major Pair levels and bias summary
  FxWirePro: USD/CAD gaining momentum for a move towards 1.4200 level
  FxWirePro- Major Crypto levels and bias summary
  FxWirePro: USD/CAD positions for another climb, eyes 1.4150 level
  FxWirePro: NZD/USD edges lower, remains on back foot
  FxWirePro : USD/JPY holds relatively bid on 163 ahead Of FOMC,BoJ meetings
  FxWirePro: EUR/NZD up trend gains momentum but hurdles ahead
  FxWirePro: EUR/NZD downside pressure builds, key support level in focus
  FxWirePro: GBP/USD downtrend loses steam but outlook still bearish
  FxWirePro: GBP/NZD downside pressure builds, key support levels in focus
  FxWirePro: USD/ZAR uptrend loses steam, remains on bullish path
  JPY Action Bias: Bullish Pairs to Watch Out For
  FxWirePro: EUR/AUD outlook weaker on renewed downside pressure


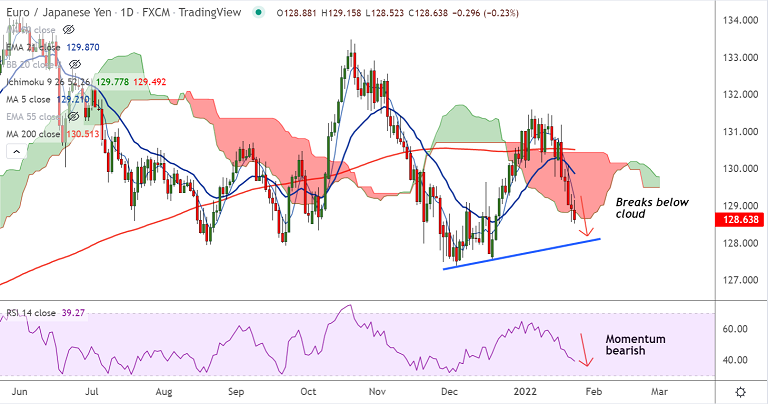
Chart - Courtesy Trading View
Technical Analysis: Bias Bearish
- EUR/JPY is extending weakness for the 3rd straight week
- Price action slips below the daily cloud
- Momentum studies are bearish, Stochs and RSI are sharply lower
- GMMA indicator shows minor trend is bearish while major trend is turning bearish
- Volatility is high and rising as evidenced by widening Bollinger bands
Support levels - 128.33 (Oct 6 low), 128 (Rising trendline), 127.45 (110-week EMA)
Resistance levels - 128.97 (55-week EMA), 129.20 (5-DMA), 129.82 (55-EMA)
Summary: EUR/JPY was trading with a bearish bias and break below cloud has reinforced downside in the pair. Bears eye 128 (trendline support). Break below to drag prices lower.


