


 Sterling Surge: GBP/JPY Smashes Above 214 With Triple EMA Blessing; Bulls Eye 217
  Gold Stalls Below $4150 as Hot CPI Fuels Dollar Strength and Safe-Haven Bid Fades
  FxWirePro- Major European Indices
  FxWirePro: NZD/USD under pressure amid US-Iran deterioration
  vFxWirePro: GBP/USD changes short term trend from neutral to bearish
  FxWirePro: GBP/AUD maintains bullish bias with focus on 1.9100
  FxWirePro: USD/ZAR steadies as investors asses Middle East conflict and US CPI figures
  AUD/JPY Dead-Cat Bounce Halted by EMA Wall; Sell-on-Rise Eyes 110.50 Target
  FxWirePro: GBP/NZD steadies around 2.3060 , retains bid tone
  FxWirePro- Major Crypto levels and bias summary
  FxWirePro: GBP/AUD gaining momentum for a move towards 1.9150 level
  NZDJPY Bulls Capped: Triple Bearish EMA Stack Signals Downtrend Path Toward 90
  FxWirePro: USD/CNY holds flat amid concerns over Middle East risks and upcoming U.S. CPI
  FxWirePro- Major Pair levels and bias summary
  FxWirePro- Major Crypto levels and bias summary
  FxWirePro:GBP/USD recovers some ground but bears are not done yet


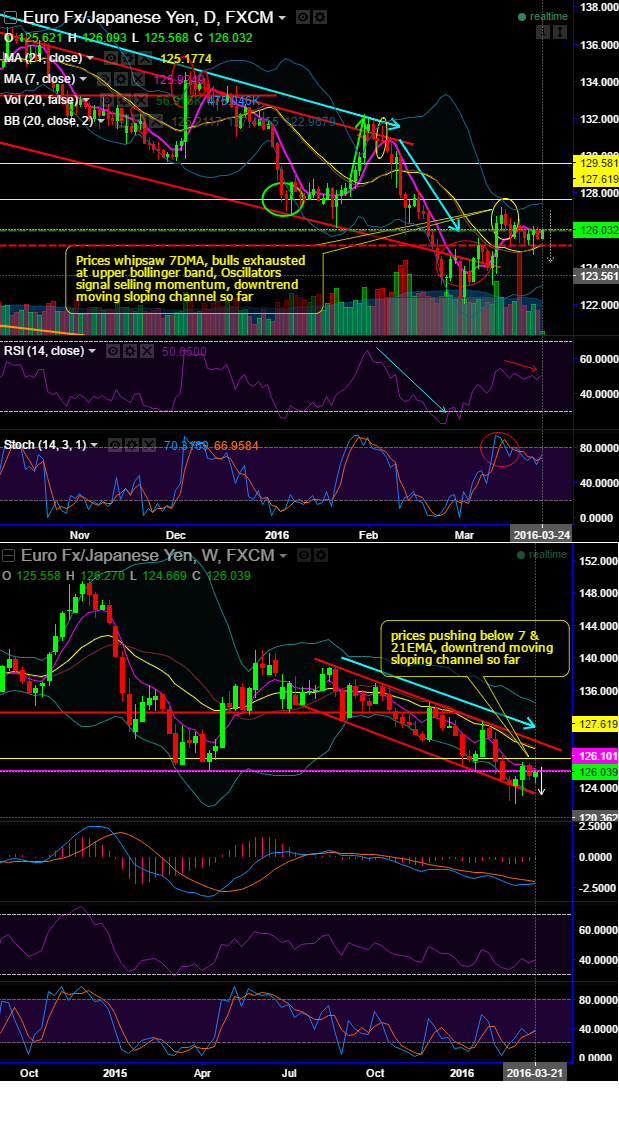
We see the price fluctuation whipsaws 7DMA at 126.05.
Short term bulls have given up the momentum in recent gains as the price curve approaches near resistance at 127.619 and upper BB (see yellow colour circled area).
Rejected at last week's highs of 127.154 levels (near resistance at 127.619) to push further downside.
On weekly also, 7EMA is acting as stiff resistance where it has lost buying interest.
Currently, on daily plotting RSI (14) trending below near 51 levels (while articulating) diverging to the previous short term short term rallies.
While, %D crossover above overbought zones signals the selling momentum, as a result bears would be on upper hand.
As a result, both daily and weekly prices hovering at 7 & 21 moving average curves (whipsaws), hence considering previous interim upswings it is perceived as ongoing downtrend would drag further.
Most probable scenario would be that it may dip back upto 125.175 levels and then retest of channel support is also potential scenario.
Trade tips: Option Tunnel Spread
On intraday charts are concerned, the current prices experience following observations,
- Price inching near Bollinger bands
- At that juncture the candles need to be very small real body like doji or resembling doji
- Upper, lower and middle Bollinger bands are almost parallel to each other
But for intraday terms, we rely on stochastic and RSI and as they pop up with overbought pressures thus far, so smart way to approach this pair is to deploy the option tunnel using ATM puts is structured as a binary version of a conventional put spread, i.e. long delta puts with higher strikes while writing the lower strikes for above mentioned targets on either side.
Therefore an In-The-Money tunnel would be formed of an In-the-money -0.75 delta put below the current exchange rate less an Out-Of-The-Money put above the exchange rate. The delta of -0.55 on combined position with slightly negative theta is preferred on this execution.
Once a tunnel is discovered a trade can be placed each time a candle cross the top or bottom Bollinger bands. You place a trade on the candle that crosses over the Bollinger bands. When the candle crosses the top Bollinger bands you place a down trade.


