


 FxWirePro:USD/JPY holds above 163 as intervention fears keep traders on edge
  FxWirePro: USD/CAD retreats slightly but trend is still bullish
  FxWirePro: USD/CNY attracts selling interest, vulnerable to more downside
  FxWirePro: GBP/NZD gains some upside momentum but still bearish
  FxWirePro: EUR/ AUD dips below 1.6300 level, focus on near term support
  GBPJPY Weakens on Soft UK CPI: Sell Below 217.80 Targeting 216.40
  FxWirePro- Woodies pivot (Major)
  AUDJPY Pulls Back on Profit Booking: Buy Dips Toward 117/118
  FxWirePro- Major Pair levels and bias summary
  FxWirePro: GBP/USD stays below 1.3400 level following cooler inflation report
  FxWirePro: AUD/USD rallies on jobs surge, heads to test key resistance
  Major Pair Action Bias: USDCHF Turns Bullish as EURUSD Stays Bearish – Key Pairs to Watch
  FxWirePro: GBP/NZD downtrend loses steam, remains on bearish path
  FxWirePro: EUR/ AUD downtrend loses steam, remains on bearish path
  FxWirePro: GBP/AUD dips amid heightened Geopolitical concerns


Intraday Bias -Bullish
Candlestick pattern- Long-legged Doji
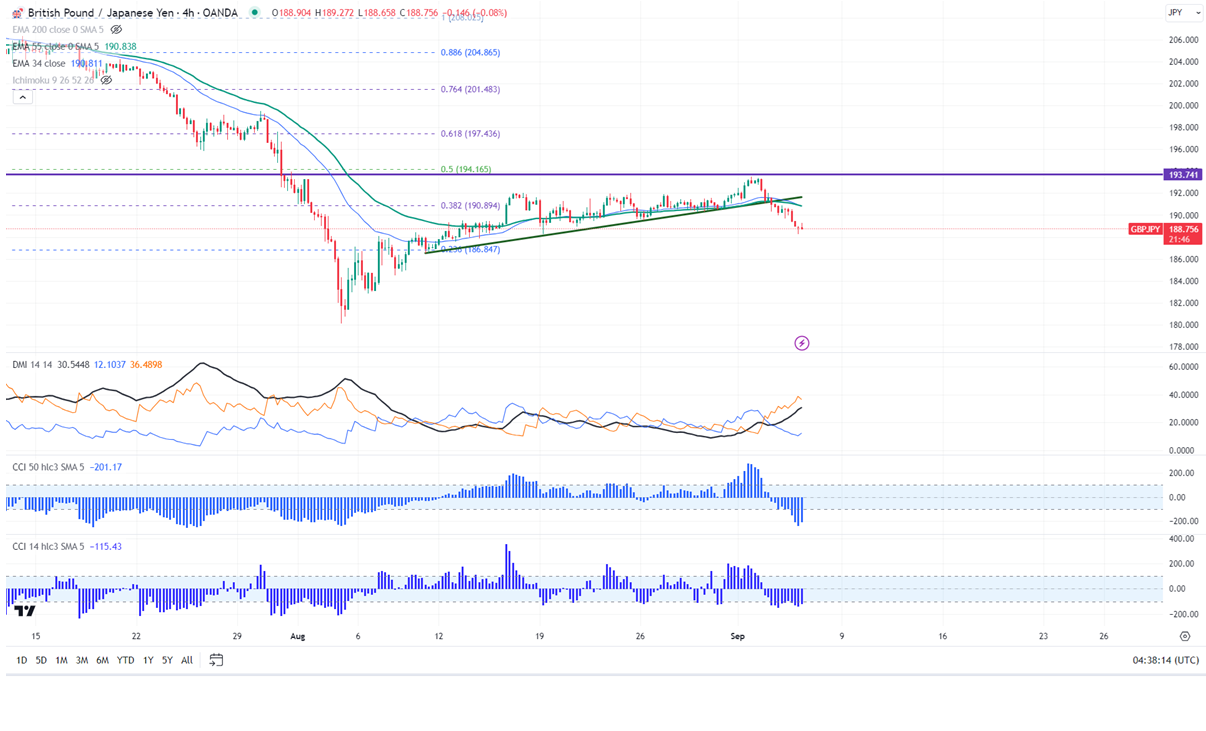
GBPJPY continues to trade weak and lost over 500 pips from 193.49 (Sep 3rd high). It hit a low of 188.23 at the time of writing and is currently trading around 189.03.
Technicals-
The pair trades below 34- and above 55 EMA in the 4-hour chart.
The near-term resistance is around 189.50, a breach above targets 190/190.50/190.91.Major trend continuation only above 193.50. The immediate support is at 188.23, any violation below will drag the pair to 187.86/186.45.
Indicator (4-hour chart)
CCI (14)- Bearish
CCI (50)- Bearish
Average directional movement Index - Bearish. All indicators confirm the bearish trend.
It is good to buy on dips around 188.70-75 with SL around 188 for a TP of 190.25/190.50.


