
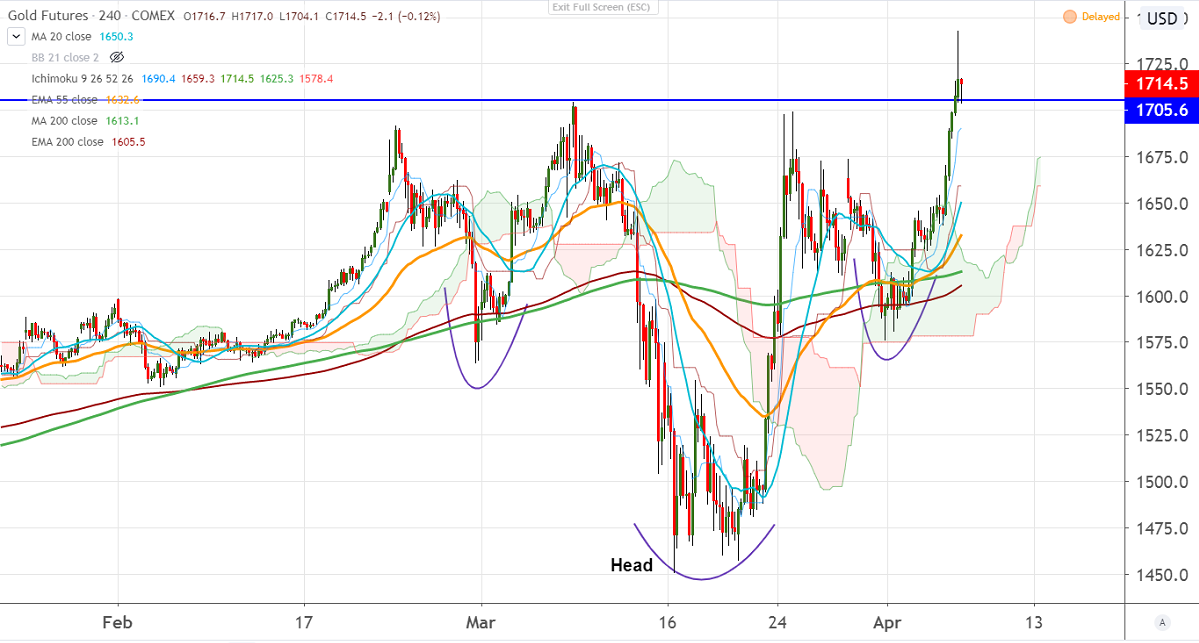
Chart pattern- Inverse Head and Shoulder pattern
Ichimoku Analysis (4-hour Chart)
Tenken-Sen- $1688
Kijun-Sen- $1659.30
Gold has shown a massive recovery of more than $100 from yesterday's low of $1638. Global stock market rallies sharply especially, the US market with Dow Jones 22680 (7% higher) and S&P500 2663.70 (7.03% ). The jump came after a slight slowdown in death due to coronavirus in Italy and the U.S. It hits a high of $1742 and is currently trading around $1711. The spread between US futures and spot has widened by almost $60 and this confirms that further rise in gold in the coming months.
The total number of people infected due to coronavirus rose to 1347235 with the U.S is in the top with 367629 and major European economies like Spain, Italy crossed 1.25 lakh.
On the flip side, near term support is at $1678 and any violation below will drag the yellow metal down till $1660/$1645.
The immediate resistance is around $1720, the indicative break above targets $1745/$1780.
It is good to buy on dips at $1675-80 with SL around $1650 for the TP of $1780.


