
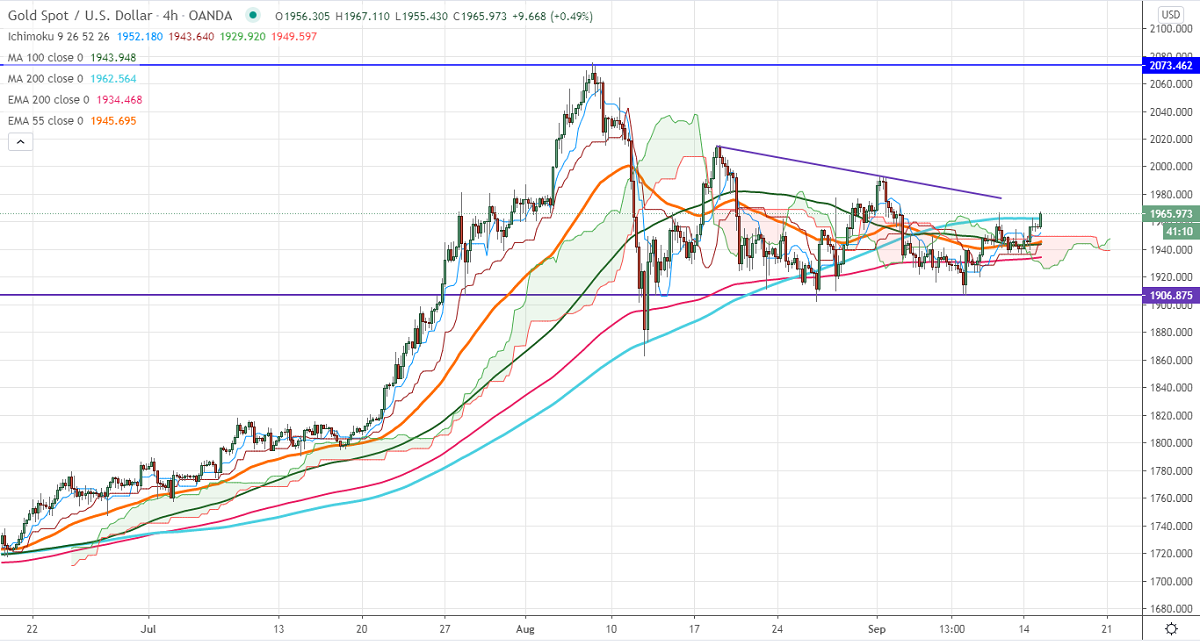
Ichimoku Analysis (4-hour Chart)
Kijun-Sen- $1949
Tenken-Sen-$1943
Gold trading slightly on the higher side and jumped more than $10 in the Asian session on the weak US dollar. DXY is on the bearish mode and holding below 93 levels. Any violation below 92.70 will drag the index down till 92.40/92. The positive Chinese data and COVID-19 vaccine hopes are putting pressure on the yellow metal at higher levels. It hits an intraday high of $1967.10 and is currently trading around $1965.11.
On the lower side, near term support is around $1933, and any violation below targets $1900. Significant selling only below $1860. A dip till $1780/$1670 is possible.
The near term resistance is around $1967, the indicative break beyond will take the commodity till $1992/$2000/$2015.
It is good to buy above $1967 with SL around $1955 for the TP of $2015.


